2021-10-30
The performance of Australian Governments in incentivizing behavioural change to reduce the carbon footprint of Australian households
By Mark Brogan, Climate Crisis Working Group
Introduction
Amid a Covid outbreak back in May, the Morrison Government took the nation by surprise when it declared that the vaccine roll-out was 'not a race'. At the time, it was pilloried for its lack of urgency. Developments with the Delta variant subsequently in New South Wales, Victoria, and the Australian Capital Territory (ACT) have further added to a pervading sense of a complacent government, that poorly assesses risk and is not on the front foot with a growing national emergency.
But there is another race that is equally as urgent. The race to decarbonise our economy and way of life to avoid catastrophic climate change. As the Glasgow Conference of Parties to the UN Framework Convention on Climate Change (COP26) gets underway, it is this race that is now front and centre. Like Covid, the narrative in this race also has the Morrison Government stuck in the slow lane. Ordinarily, this would be a race in which the Government would be comfortable to be scratched from the field. But recent events have shifted the goal posts on climate policy fundamentally and made climate denial less tenable for a denialist government.
These events include the G7 Carbis Bay Communique[1], International Energy Agency (IEA) Net Zero by 2050 Report[2] and the Intergovernmental Panel on Climate Change (IPCC)’s Working Group Report on the physical science of climate change.[3] Collectively, they have made persistence with outright denial untenable on the world stage and resulted in the weak Australian bottom draw target of net zero by 2050. Having settled on this target, after much argy bargy with the Nationals, this is the slim baggage that the government is taking to Glasgow after eight years of denial and prevarication.
In the Carbis Bay Communique, the G7 nations committed to collective action aimed at limiting the rise in global temperatures to 1.5 degrees.[4] To achieve this goal, the G7 committed to cutting emissions to "around half compared to 2010 or over half compared to 2005."[5] Net zero greenhouse gas emissions were to be achieved "as soon as possible and by 2050 at the latest."[6] IEA’s May statement, Net Zero by 2050, added to a sense of urgency declaring that exploitation and development of new oil and gas fields must stop in 2021 and no new coal-fired power stations should be built, if the target of Net Zero by 2050 was to be achieved.[7] In August, IPCC’s Physical Sciences 6th Assessment Working group chimed in with an alarming report on the rapidity and intensity of climate change and the need for deep and sustained emissions reductions beginning immediately.
Carbis Bay marked a turning point with the world’s biggest most influential economies agreeing for the first time on a plan of action. It was big, bold stuff. But not everyone was singing from the same song book. On the sidelines with observer status only, Australia took on the role of spoiler. Australia would give no firm commitment to increase emissions cuts in line with the G7 and would not commit to a firm date for net zero carbon emissions. The spectacle was one of Morrison being diplomatically outed for what we have known for a long time. Namely, that the Coalition would rather die in the ditch with its fossil fuel benefactors, than do the right thing on climate.
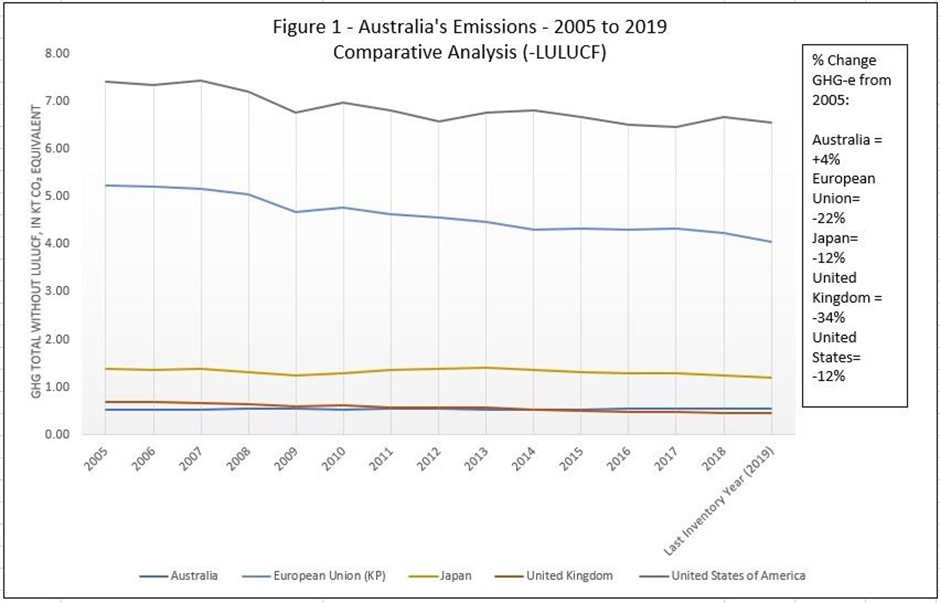
And it is doing very little on climate. As part of the Paris Agreement in 2016, the Australian Government committed to a target for GHG emissions reduction of 26-28% on 2005 by 2030.[8] Considered a weak target at the time, since Paris, obfuscation, dodgy accounting[9] and massive plans to expand the fossil fuel industry form the back story to expansion of Australia's carbon pollution and the weak position taken to Glasgow. The reality is that claims of reduction are mostly attributable to short term effects from Covid and Land Use, Land-Use Change and Forestry (so-called LULUCF) sequestration effects. When LULUCF is excluded[10], Australia's emissions are increasing, placing it on a trajectory at odds with the G7. Figure 1 describes the trend:
In its delinquency, the Australian Government has been open and voluble in its intention to go its own way on climate change, suggesting that whatever it loses in credibility on the world stage, it makes up for in domestic political advantage. These are the advantages of ‘back of the ute’ diplomacy in regional marginal electorates in NSW and QLD ‒ some won from Labor in 2019, and others, that it hopes to win in the coal and gas belts at the next Federal election. Thumbing it’s nose at world consensus to act on carbon pollution also ensures a steady stream of re-election campaign funding from fossil fuel companies. Companies that are also pushing for expansion of Australia’s carbon pollution via new coal and gas projects. By not re-casting our 2030 emissions reduction target as part of a re-worked Nationally Declared Contribution (NDC) for COP26, the Morrison Government is paving the way for further expansion of Australia's GHG pollution, driven by new coal and gas projects. The scope of these new projects is inconsistent with its declared goal of net zero by 2050.
Toxic as this may be to world resolve at Glasgow, the Australian Government does not have the power to oblige the world to walk away from the Paris Agreement target of 1.5 degrees. The world may choose to exercise trading power in ways that oblige Australia to take emissions reduction seriously, even if it has no stomach for it. For example, through the application of carbon border tariffs, it can effectively price the carbon in Australian exports directly, of where they are used in supply chains.[11] From the vantage point of a Covid ravaged world in 2021, it is unclear how the carbon wars will play out, but it is likely that the Australian Government will eventually be compelled to come to its senses over climate change and the need to seriously curb emissions. Before the rubber hits the road on carbon border tariffs.
So it is that we have arrived at a place where the Australian Government has embarked for Glasgow with ‘slim baggage’, consisting of a fig leaf commitment to net zero carbon emissions by 2050, not backed by legislation, with no revised 2030 emissions reduction target. A scandalously inadequate position that will inflict climate harm on our children and generations to come.
Future theft is not an uplifting narrative. It would be time to put the keyboard to one side, if not for the rise of green shoots that suggest the case for optimism as Australia wrestles with its climate challenge. These green shoots include the rise of a new Federalism, business adoption of net zero and household decarbonisation activism.
New Federalism is the phenomenon in which States and Territories are stepping up to provide goods, services and demand side drivers for decarbonisation and energy transition. Business is also coming on board as climate reputational risk (social warrants) and business logic (cost savings and customer relations) are working to scale up action. In board rooms and CEO thinking, net zero is now a work in progress in business transformation. Finally, there are the actions taken by individuals and households to take responsibility for their carbon footprint. As the song goes, from little things, big things grow.
Increasingly State and Territory Governments are taking on responsibility to align emissions with a Paris compatible fair share of GHG-e and to expedite transition to a low carbon economy. Activity encompasses a range of activity in sectors such as energy, agriculture, manufacturing, and transport. Some activity is aimed at shifting consumer tastes and preferences from carbon intensive to low carbon goods and services. Actions include programs that incentivize individuals and households to decarbonise. But just how important are households?
The carbon footprint of Australian households
In 2019, according to the Australian Government's National Greenhouse Accounts[12], which includes a national inventory of emissions by economic sector, ‘residential’ annual direct and indirect emissions amounted to 106 (Mt CO2-e) equivalent to around 20% of total emissions.[13] Impressive as this figure sounds, it excludes transport. It is also fails to account for the embedded carbon consumed in food or other consumption of carbon intensive goods and services. It is a fact however, that most global production ends up in household consumption. When this approach to measurement is taken, some researchers have estimated that up to 72% of global emissions can be attributed to household consumption.[14]
In the policy vacuum created by a delinquent Federal Government, explaining and stimulating household decarbonisation has devolved to State and Territory Governments. So, what does the national scorecard look like?
Government programs that stimulate household decarbonisation in Australia are effective across three sectors ‒ the energy households’ consume, services and appliances that households’ use and household use of transport. Most of these programs incentivize behavioural change in consumption forming what economists refer to as ‘demand side’ enablers for household decarbonisation. Consumer demand side enablers include grants or rebates, discounts, loans, and other direct assistance to households that encourages the use of low or zero carbon products or services. Some ‘supply side’ decarbonisation enablers are also important. In this survey of household decarbonisation, some supply side enablers have been included where:
- technology maturity suggests that they should be included.
- availability describes a decarbonisation incentive to households based on co-benefits, altruism, or both; and
- via substitution for the carbon intensive alternative, substantial gains could be made in terms of a household’s carbon footprint.
E-buses are a good example of such a supply side factor. Where available as an alternative to Internal Combustion Engine (ICE) private vehicle journeys, commuters can make a substitution with CO2 and air pollution savings.
A word of warning on the survey that follows. In common with the private sector, there is a lot of 'greenwashing' in the public policy space. Typically, this is seen where Governments operate programs in 'demonstration', ‘pilot’ or 'feasibility testing' mode. In the interests of integrity and reliability, programs self-described in this way and not currently implemented at scale have been excluded from the program count. The study took place in the September quarter, 2021 and did not include building and renovation decarbonisation incentives or food. Programs were counted by type and responsible Government entity. Acknowledged limitations of the survey include the omission of funding, food and building construction.
I. Energy Decarbonisation
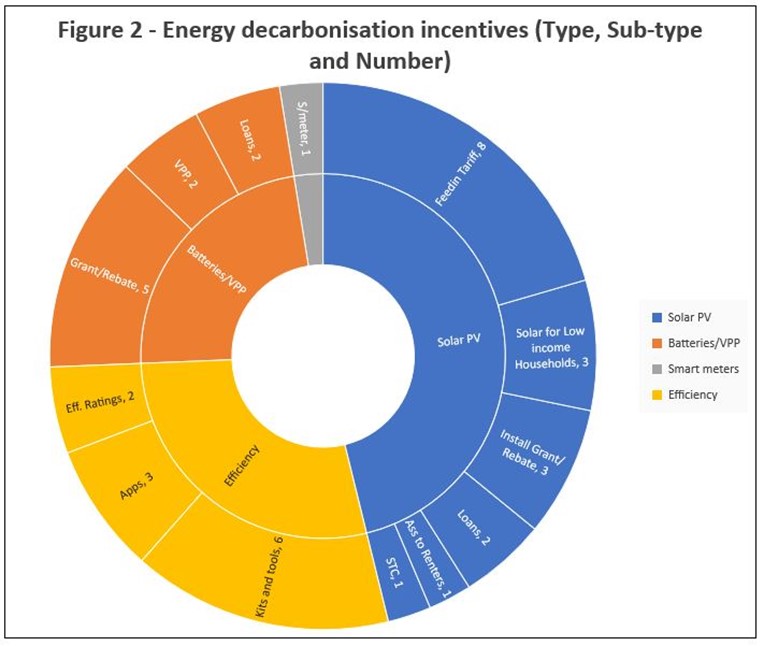
Government incentives for decarbonisation of household energy comprises the largest category of incentives on offer to Australian households. Thirty-nine (39) programs were found operating nationally during the period of the survey that aimed to incentivize household conversion to low or zero carbon emission technologies for energy needs. These programs included Distributed Energy Resources (DER) such as solar PV and batteries, Virtual Power Plants (VPPs) and programs promoting the efficient use of energy in households. Demand drivers were found to include feed-in tariffs, grants, rebates, tradable certificates (STCs), loans, discounts, free upgrades, and waivers. All working to encourage households to convert to low emission or carbon zero solutions for household needs. Programs encouraging the adoption of rooftop solar PV accounted for just under half of program offerings (47%), batteries and VPP (22%), smart meters (3%) and energy efficiency (28%). Figure 2 describes the program distribution by type, sub-type, and number:
The distribution of these programs reveals four governments leading the pack by a substantial margin - VIC, NSW, ACT, and SA. (Figure 3):
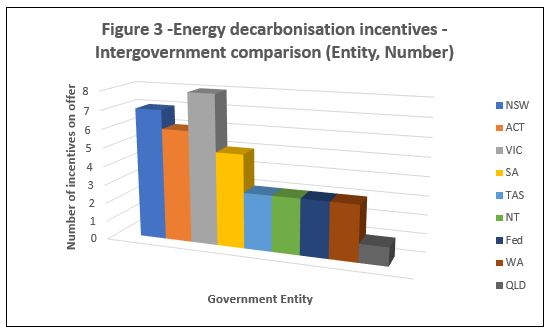
Rooftop solar uptake nationally is supported by feed-in tariffs and the Small-Scale Technology Certificate (STC) system. The feed-in tariff system has been progressively implemented by State Governments since 2008, when the Council of Australian Governments (COAG) agreed a set of National Principles (amended in 2013). STCs provide an effective discount on solar system acquisition to consumers based on the Commonwealth's Renewable Energy Target (RET). Additionally, states leading on household energy decarbonisation (NSW, ACT, VIC, and SA) offer rebates and other purchasing incentives across rooftop solar and batteries. However, only three governments (NSW, ACT, WA) have assistance packages specifically targeting low-income households.
A Virtual Power Plant (VPP) aggregates, manages and controls DERs such as rooftop solar and batteries to deliver services to households and communities, in a similar manner to a conventional power plant. At the time of survey, only NSW and SA had proceeded beyond small scale feasibility studies to limited rollout.
II. Appliances and Household Services Decarbonisation
The survey uncovered twenty-seven (27) government programs operating nationally that encourage household adoption of low carbon appliances and household services. Figure 4 describes the distribution by type and sub-type:
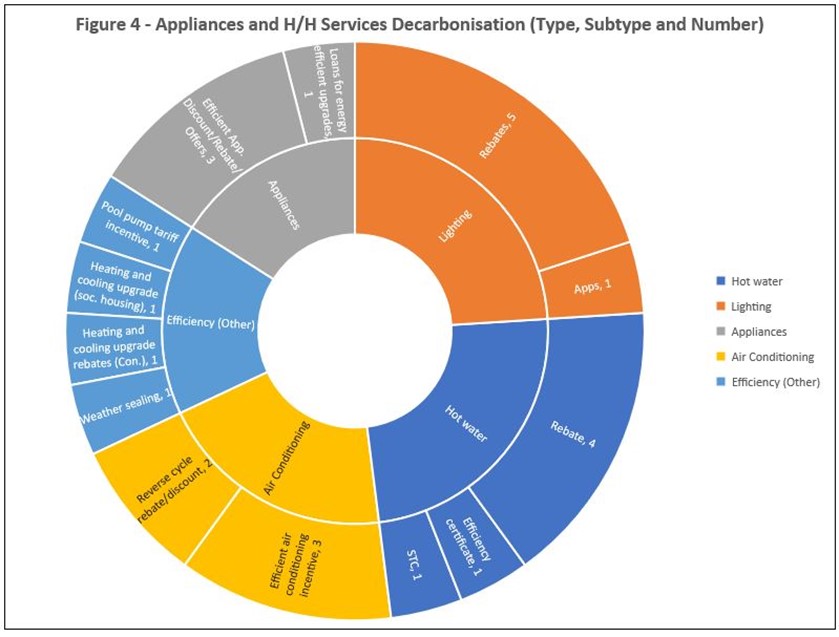
Figure 5 below describes the scorecard by Government entity. Four (4) states (ACT, VIC, SA & NT) offered cash rebates or discounts incentivizing heat pump adoption for the provision of hot water. Industry data shows that in an average household, replacement of gas with heat pumps can readily reduce household greenhouse gas emissions by up to 5 tonnes per year, at lower lifecycle cost than using gas.[15]
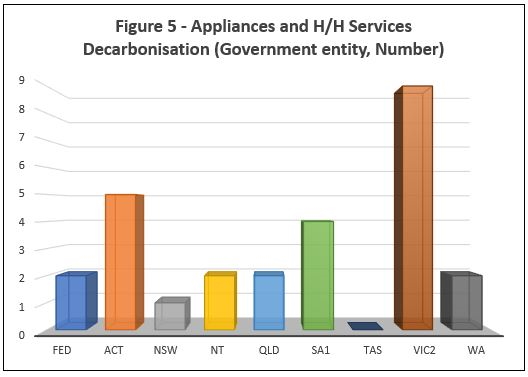
Equity programs aimed at making low carbon appliances and services (heating/cooling/lighting) available to low-income households were found to be operating across three states (SA, VIC and WA). In appliances and household services decarbonisation, ACT, VIC and SA were the standout overall performers accounting for two-thirds of the programs on offer.
III. Transport Decarbonisation
Transport is Australia’s third largest source of GHG emissions, of which household transport emissions account for approximately one half.[16] Electrification of transport is rapidly becoming a reality in the global race to decarbonise. In Europe, the market share of electric vehicles grew from 3.6% in 2019, to 11% in 2020.[17] In 2020, Norway kept its role as a frontrunner with 75% of all new passenger car registrations being a BEV or PHEV.[18] Europe expects to have 1 million public charging points and 13 million zero and low emission vehicles by 2025.[19] After setbacks under the Trump administration, in the US the Biden administration has secured the passage of an infrastructure Bill that includes $7.5 billion on electric buses and a further $7.5 billion on EV infrastructure.[20] As of July, 2021 sales of EV vehicles in Australia amounted to just 2.1 % of new car sales, well below the EU and other markets.[21]
The survey tracked performance in the provision of demand and some supply side adoption stimulus programs across Electric Vehicles (EVs), Electric Bikes (E-Bikes) and Electric Buses (E-buses). ACT, NSW & VIC were clear leaders by scope in EV demand and supply side stimulus programs on offer (Figure 6):
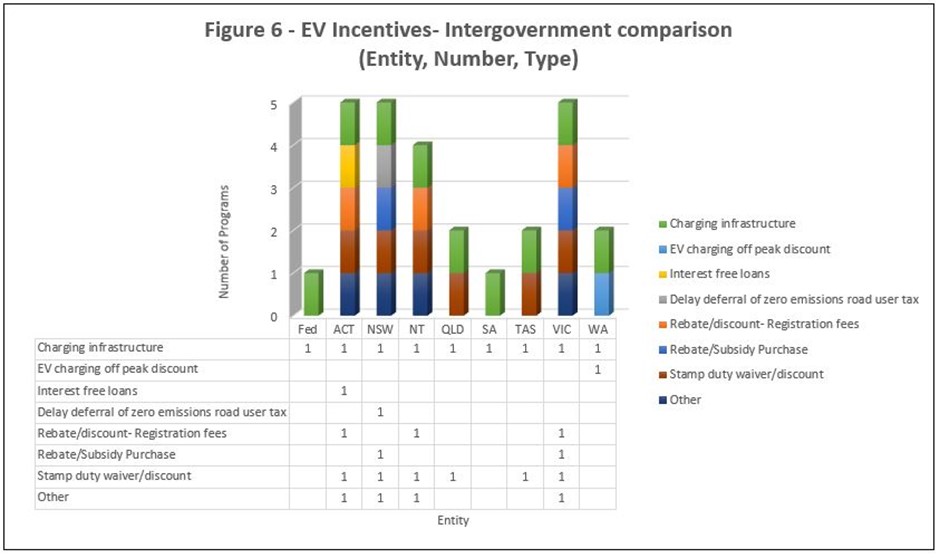
Provisioning of public charging infrastructure formed the most common enabler on offer. All states and territories have infrastructure programs aimed at expanding charging infrastructure, a critical incentive to adoption given range constraints with many EVs. Subject to funding caps, rebates (subsidies) on purchase were on offer in NSW and VIC. Stamp duty waivers/discounts were available in ACT, NSW, NT, QLD, TAS & VIC. As the chart shows ACT, NSW and VIC are class leaders by incentive number, range, and value. By number, scope and value of program offerings, the Commonwealth, WA, TAS and SA were found to be weak performers in the provisioning of EV stimulus programs.
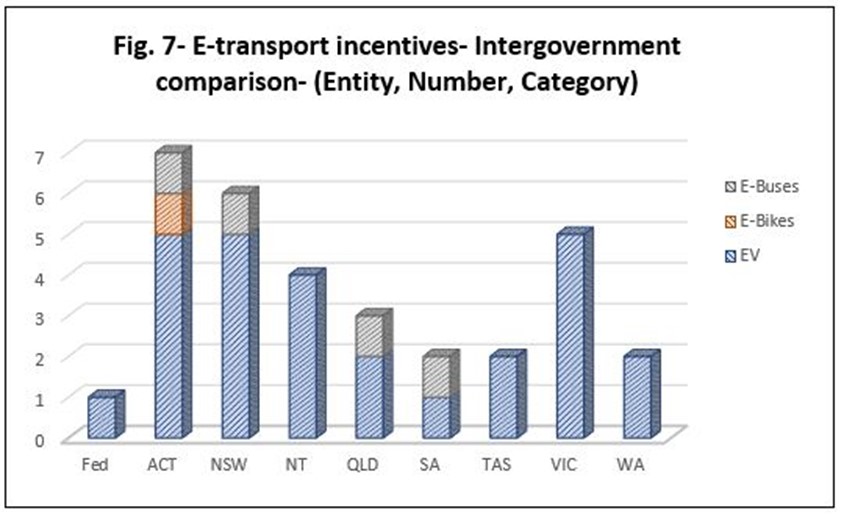
The availability of carbon neutral public transport incentivizes households to leave Internal Combustion Engine (ICE) vehicles in the garage. However, only four States were found to have contractual arrangement for the rolling out of E-buses – ACT, NSW, SA and QLD. In the E-bus sector, while small scale feasibility or demonstration projects were relatively common, rollout is in its infancy. Figures include Brisbane City Council’s decision in late July of a successful tender for sixty (60) zero emission battery electric buses.[22] Some qualifications apply. With an extensive electrified tram rail network, the E-bus option is less relevant in Victoria for mass commuter transport. Rather the Victorian Government has elected to upgrade this network to battery electrification as part of a $1.48 billion modernisation plan.[23]
For short single commuter journeys and where shared path infrastructure exists supporting them, E-bikes and scooters provide a low or zero emission option. Only the ACT has a current program that incentivizes E-bike use. Expanding the scope of low or zero carbon options to include programs promoting E-bike adoption and/or the provisioning of an E-bus alternative to motor vehicles, the national scorecard on household transport decarbonisation incentives again demonstrates the program leadership of NSW, ACT and VIC (Figure 7):
Discussion of Findings
Figure 8 provides an aggregated view of government incentives across the three surveyed sectors of low carbon energy, transport, services, and appliances. In terms of the number of programs on offer VIC ranked one (1), followed by ACT, NSW, and SA. The gap between States that are active in promoting behavioural change, as measured by the scope and number of program offerings and those that are inactive, is chasmic in size (max=22, min=5, average=11).
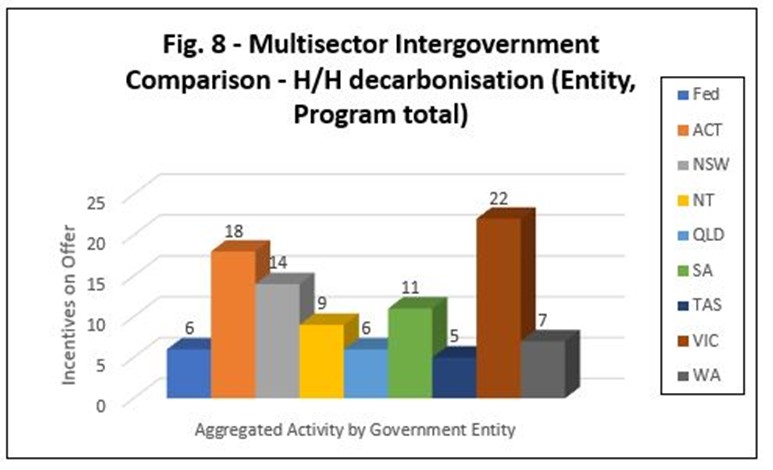
Review of histogram data showing the frequency distribution reveals a moderate positive skew that characterizes under performance as usual. The majority of Australian governments have only a handful of programs incentivizing household decarbonisation.
In summary, the study finds that by scope and number of program offerings:
1. Performance is uneven across Australian Governments with a small leadership group (ACT, NSW, VIC) and larger cohort of underperforming governments (Fed, QLD, TAS, NT & WA).
2. Nationally, there is an under-representation of programs that comprehensively address decarbonisation in low-income households. In ACT, NSW and WA programs are on offer that address solar accessibility for low-income households. In SA and VIC, the equity focus is on services and appliances.
3. Performance is best overall in Distributed Energy Resources (DER) where feed-in tariffs and STCs have sustained higher levels of DER decarbonisation in households. The effect of this on Australia’s emissions has been considerable. To the extent to which Australia has been able to demonstrate progress towards its current Paris goal of reducing emissions by 26-28% excluding LUCUF, this has been done in the electricity sector on the back of behind the meter renewable energy (solar PV) and wind. This is a rare, good news story that Australia can tell in the absence of national direction on the energy transition and climate policy.
4. Transport decarbonisation is underdeveloped, with meaningful EV incentives on offer in NSW, ACT, VIC, & NT but missing elsewhere. Meaningful progress with the rollout of E-buses is being achieved in ACT, NSW, QLD and SA, but not elsewhere.
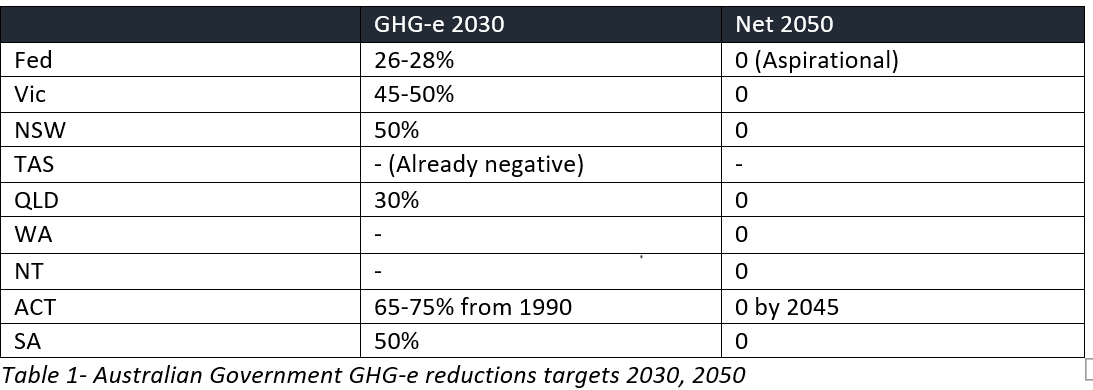
5. The average number of programs per government entity across the three program sectors was 11. Five Australian Governments recorded program scores below the national average (Fed, NT, QLD, WA, TAS). Four of these Governments (Fed, QLD, NT & WA) are also at the back of the class when it comes to GHG-e targets for 2030 (Table 1).
Reviewing more data on from Australia’s National Greenhouse Accounts, it is clear that WA and NT are currently on a path of GHG-e expansion.[24] If LULUCF is excluded, the sub-set of delinquent Governments expands to include QLD.[25] GHG-e expansion in these states and territories can be expected to grow further as a consequence of new mega projects such as Scarborough and Pluto in WA (LNG), Beetaloo in NT(unconventional/fracked gas) and Adani Carmichael in QLD (coal).
Conclusion - Life in the ‘Slow Lane’
Findings from analysis of the data on demand and supply stimulus programs for household decarbonisation aligns with evidence of ‘carbon culture’ found in emissions reduction targets and performance on emissions as measured by Australia’s National Greenhouse Gas Accounts. Governments that are underperforming on policy to promote household decarbonisation are also failing more broadly in setting GHG-e reduction targets and reducing emissions.
Incentivizing households and individuals to change consumption behaviour in favour of low or zero carbon household solutions is low hanging fruit. Momentum to reduce the carbon footprint of Australian households draws upon the altruism of Australian households, but also involves attractive co-benefits such as reduced energy costs. Taken together, these factors have been shown to be effective in driving behavioural change in Australian households. The rooftop solar revolution is a standout demonstration case. Currently, Australia has the highest uptake of rooftop solar globally, with one in four households hosting a system.[26]
More can be achieved through efficiently designed and targeted programs that incentivize a low carbon footprint and lifestyle. There is a huge reserve of social capital that has yet to be fully harnessed to the cause of decarbonisation. Opinion polls continue to demonstrate that households take climate change more seriously and are more committed to action than the Governments that represent them.[27] Away from the political battlefield of energy policy and fossil fuel industries, clear opportunity exists for Governments to build on grassroots sentiment and to shift Australian household behaviour to decarbonising options in energy, transport and household appliances and services.
Moving from the slow to the fast lane on decarbonisation need not be painful, and the early evidence suggests high levels of voter support for Australian Governments prepared to take up the challenge through incentivizing behavioural change.
ENDNOTES
[1] The White House. (2021). Carbis Bay G7 Summit Communique. June 13. Retrieved from: https://www.whitehouse.gov/briefing-room/statements-releases/2021/06/13…
[2] International Energy Agency. (2021). Net Zero by 2050. Retrieved from: https://www.iea.org/reports/net-zero-by-2050
[3] Intergovernmental Panel on Climate Change. (2021). Climate Change 2021: The Physical Science Basis. Retrieved from: https://www.ipcc.ch/report/sixth-assessment-report-working-group-i/
[4] The White House. (2021). Carbis Bay G7 Summit Communique. June 13. Retrieved from: https://www.whitehouse.gov/briefing-room/statements-releases/2021/06/13…
[5] Ibid.
[6] Ibid.
[7] International Energy Agency. (2021). Net Zero by 2050. Retrieved from: https://www.iea.org/reports/net-zero-by-2050. p.99
[8] Climate Action Tracker (2021). Australia: Summary of Pledges and Targets. Retrieved from: Pledges and Targets | Climate Action Tracker
[9] R. Merzian and P.Hanning. (2021). Banking on Australia’s Emissions: Why creative accounting will not get us to net zero emissions. p.12 Retrieved from: https://australiainstitute.org.au/wp-content/uploads/2021/05/P1076-Bank…
[10] United Nations. (n.d.). Time Series – Annex 1. Retrieved from: https://di.unfccc.int/time_series
[11] O’Mally, M. (2021). Europe’s controversial carbon plan could be a global game-changer. WAToday, July 15, 2021. Retrieved from: https://www.watoday.com.au/world/europe/europe-s-controversial-carbon-p…
[12] Australian Government. Department of Industry, Science, Energy and Resources. (2021). National Greenhouse Accounts 2019. Retrieved from: https://www.industry.gov.au/data-and-publications/national-greenhouse-a…
[13] Australian Government. Department of Industry, Science, Energy and Resources. (2021). Figure 6 National-inventory-by-economic-sector-2019-data-tables.xlsx Retrieved from https://www.industry.gov.au/data-and-publications/national-greenhouse-a…
[14] Vide Druckman, A. and Jackson, T. (2016). Understanding Households as Drivers of Carbon Emissions. ResearchGate. Retrieved from: https://www.researchgate.net/publication/301264761; Sovacoo, B. et. al., (2019). Temporality, vulnerability, and energy justice in household low carbon innovations. Energy Policy. 128 (2019). 496-504; Dubois, G. et.al. (2019). It starts at home. Climate policies targeting household consumption and behavioral decisions are key to low-carbon future. Energy Research and Social Science. 52, 144-158
[15] Blakers, A. (2019). How to neutralize your greenhouse gas footprint. The Conversation. Retrieved from: https://theconversation.com/how-to-neutralise-your-greenhouse-gas-footp…
[16] Climate Council. (2017). Factsheet: Transport Emissions: Driving Down Car Pollution in Cities. Retrieved from: https://www.climatecouncil.org.au/wp-content/uploads/2017/09/FactSheet-…
[17] International Council on Clean Transportation. (2021). On the electrification path: Europe’s progress towards clean transportation. Retrieved from https://theicct.org/publications/electrification-path-europe-mar2021
[18] Ibid.
[19] Ibid.
[20] Ohnsman, A. (2021). Tweaked Infrastructure Plan Keeps Funds for Biden’s EV Chargers, Trains and Clean Buses. In Forbes June 24, 2021Retrieved from Tweaked Infrastructure Plan Keeps Funds For Biden’s EV Chargers, Trains, Clean Buses (forbes.com)
[21] Schmidt, B. (2021). A significant month: EV sales jump fourfold with Tesla Model 3 leading way. Retrieved from:https://thedriven.io/2021/08/04/a-significant-month-ev-sales-jump-fourf…
[22] Brisbane City Council. (2021). Brisbane Metro Vehicle. Retrieved from: https://www.brisbane.qld.gov.au/traffic-and-transport/public-transport/…
[23] Victorian Government. Office of the Premier. (2021). Trams – Made and Maintained in Victoria. Retrieved from: https://www.premier.vic.gov.au/trams-made-and-maintained-victoria
[24] Australian Government. Department of Industry, Science, Energy and Resources. (2020). State and Territory Greenhouse Gas Inventories 2018, p.3.
[25] Australian Government. Department of Industry, Science, Energy and Resources. (2021). National Greenhouse Accounts 2019. State and territory greenhouse gas inventories: Annual emissions. Retrieved from Retrieved from https://www.industry.gov.au/data-and-publications/national-greenhouse-a…
[26] CSIRO (2021). Australia installs record-breaking number of rooftop solar panels. Retrieved from: https://www.csiro.au/en/news/news-releases/2021/australia-installs-reco…
[27] WAToday (2021). Australia’s biggest climate poll shows support for action in every seat. (August 30, 2021). Retrieved from https://www.watoday.com.au/environment/climate-change/australia-s-biggest-climate-poll-shows-support-for-action-in-every-seat-20210829-p58mwb.html
[Opinions expressed are those of the author and not official policy of Greens WA]