2025-07-04
Analysis of final preference distribution in 3 way lower house election contests involving the Greens provides direction towards a winning campaigning strategy, as demonstrated for the recent federal election.
By Donald Clarke, Fremantle-Tangney Greens
To be in the hunt to win a federal House of Representatives (HOR) seat, the Greens become locked into a three-horse race with the ALP (Labor) and the Liberals (Libs). In such races, it is not so much which party/candidate gets the most first preference votes, but who gets preferenced the most above the other two.
Looking at primary (first preference) swings does not give a good indication of what was the voting margin of loss (or what is required to win) in an electorate of this type; more informative are the swings between the three most preferred parties as determined by the AEC vote counting system. This essay will either lead you into the wonderful world of three party preferencing and better grasp how close voting results are in three-way elections (and maybe inform your campaign strategy), or further confuse the hell out of you.
3PP
How often one party is preferenced above the other two is revealed during the final stage of vote counting, at the full distribution of preferences. The three party (or candidate) preferred count (3PP or 3CP) is the step in this distribution where votes are distributed to whichever one of the three leading parties appears first in the ballot preferencing.
In the 2025 federal election, a Greens candidate was one of these three parties after the 3PP count was complete for 82 HOR electorates, in each case Labor and Libs being the other two ‘contenders’.
Ben Ruae has analysed the different combinations of parties making up the 3PP for the 150 HOR seats in 2025. Labor and the Liberals were two of the three parties making the cut in 148 seats. As well as the Greens in 82 seats, independents were the third ‘party’ in 35 seats, One Nation 26, Katter’s Australian Party 2, Centre Alliance 1, and in 3 seats the Libs and Nationals were in a 3 way with Labor (all in WA).
2PP
For the final step in counting, once the 3PP is determined, the votes allocated to the candidate/party with the lowest count at this point are then distributed to the two other parties. Those votes for the 3rd party are allocated to whichever of the two higher parties is preferenced above the other on each vote. This is the 2PP (or 2CP) count, such that whoever now has above 50% of votes after this distribution is the winner.
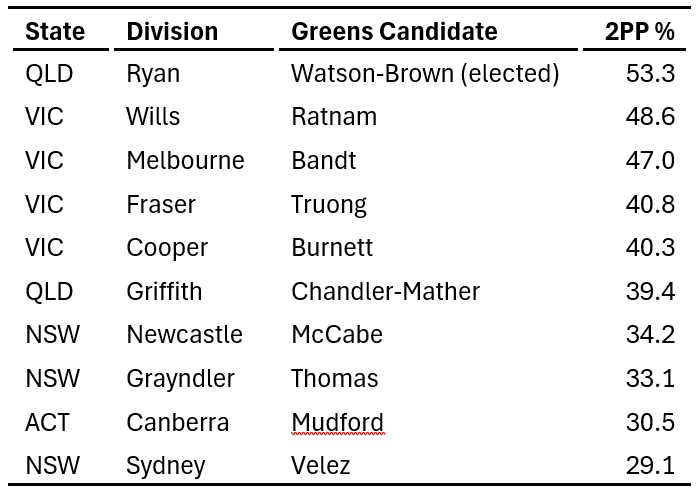
In 2025, Greens candidates made the 2PP split in electorates10 times as in Table 1 below, only once alongside Libs where Greens won Ryan, and 9 times in the very progressive electorates won by Labor.
Table 1: 2025 Greens HOR 2PP results
2PP Preferencing Flows
The reallocation of the votes from the party that came third in the 3PP to the other two parties is never equally divided; the preferencing flow to one party will generally be greater for one than the other. For example, for Wills in the 2022 election, 26.7% of those voters who preferenced Libs above Labor and Greens, then had Greens preferenced above Labor; only a bit more than a quarter of the Libs 3PP vote went to Greens at 2PP. And this 2PP preferencing to the Greens was less than a quarter in 2025.
Table 2 below shows, for both 2022 and 2025 elections, the percentage of Libs votes at 3PP that were then distributed (flowed) to the Greens in the HOR seats where the Greens fell second to Labor.
Note that the Greens did not finish 2PP in 2022 in Fraser or Newcastle, and in that election Libs were the other 2PP party in Griffith.
Table 2: Federal election 2025 2PP preference flows to Greens
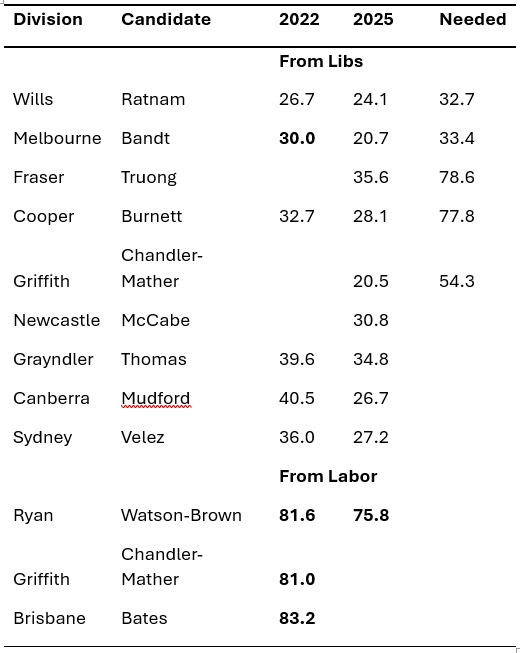
It can be seen that for 2022, preference flow to the Greens from Libs 3PP were around 30% in the Victorian seats, 36% in Sydney and around 40% in Canberra and the PM’s seat of Grayndler (the latter two can be considered atypical contests). The 3PP Libs distribution to the Greens were, however, significantly lower everywhere in 2025. Melbourne was down from 30% for the 2022 win to a historic low of 20% along with Griffith, most of the others in the range 24-30%, and Fraser joining Grayndler at around 35%.
Preference flows to win
Also shown in Table 2 above is the percentage of Libs 3PP votes that would have needed to be distributed to get the Greens 2PP count above 50% (and thus win those seats) in 2025 (assuming the 3PP counts remained the same). In Wills and Melbourne, the Greens candidates were well in front of Labor on the 3PP count but needed a good third of Libs 3PP redistributed to them to win. Melbourne was lost with a 2PP swing of -8.6%, and while some of that was due to a reduced primary vote, a repeat of the more usual 30% of the Lib 3PP preference flow going at the 2PP count to Greens over Labor would have nearly retained the seat.
In Fraser and Cooper, Labor was well in front on 3PP and the Greens candidate unrealistically needed more than three quarters of the Libs 3PP preference flow to pass them to reach 2PP.
In Griffith in 2025, given Labor was ahead of Libs and just above Greens at the 3PP count, Max needed more than half of the Libs 3PP preferences to win and got less than half of that.
Table 2 also shows the distribution of Labor 3PP preferences to the Greens when Greens and Libs finished 2PP for Griffith and Brisbane in 2022 and Ryan in both elections. In 2022, these were all above 80%, although less for Ryan 2025.
Preference flows in Table 2 for seats that the Greens won are bolded. Clearly, for these 3 horse races, any seat where Greens and the Libs lie above Labor on 3PP count, the Greens win. To win a seat where Greens and Labor are the ‘contenders’, Greens need to be far enough in front of Labor at the 3PP count so that receiving only a smaller portion – say a third ‒ of the Libs 3PP preferences at 2PP (with 2/3s going to Labor) is enough to remain first (i.e. at 3PP count, Greens must be above Labor by something more than 1/3 of Libs 3PP count).
In Melbourne, for the Greens to have won a 2PP against Libs (rather than lose against Labor), Adam needed nearly 13% of voters who had preferenced Libs above Labor above Greens, (2,940 voters, which is 3% of the total vote) to have switched the order of the latter two so they put Greens above Labor instead.
Winning/losing margins
In fact, for the Melbourne election (where Labor and Greens were 2PP), the Greens needed 3% of voters who had Labor preferenced above Greens to instead have Greens above Labor, irrespective of who their first preference was. Putting the Greens 5th and Labor 6th on a ballot is just as benefiting to the Greens as putting Greens 1st and Labor lower down.
The latter point applies to all the Greens/Labor 2PP contests. Wills was the closest Greens loss (closest 2PP to 50%) as shown in Table 3 below; while true that 1.5% of voters who gave Labor first preference changing that to the Greens instead would have given a Greens win, swapping that order of preferencing on any ballot has the same effect.
Table 3: Percent swing needed in preferencing Libs or Greens above Labor for Greens win
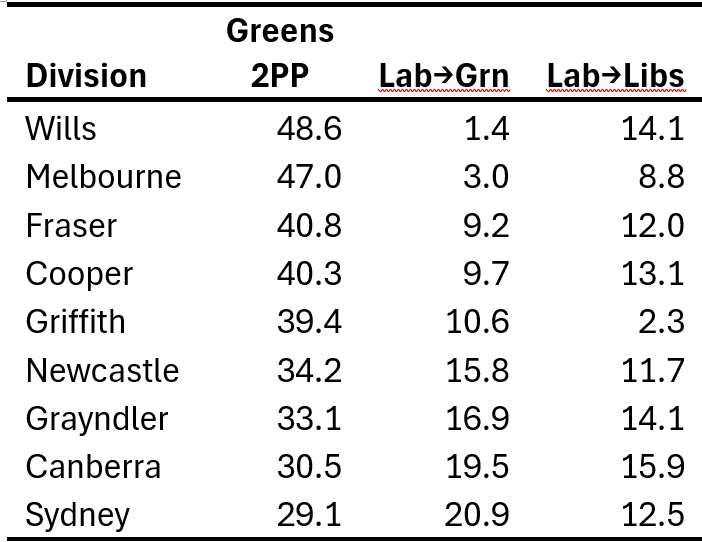
Table 3 shows, for all the 2025 Greens/Labor 2PP contests, the percentage of voters needing to change their preferencing to have Greens above Labor, the 2PP swing, to bridge the gap between the 2025 2PP and 50%.
There is another way, one that Greens supporters may not ordinarily consider in looking at election winning/losing margins, to get to a result of these 3 horse races in Greens favour. This is for a 3PP swing from Labor to the Libs that gets the Libs 3PP count above that of Labor. This scenario has enough voters changing their order of preferencing from Labor above Libs to the reverse, where they have both of them above the Greens, so that Libs as well as the Greens heads Labor in the 2PP count. Then the Greens win on the final distribution of Labor preferences.
Of course, there is no foreseeable future where Greens are going to encourage non-Green voters to preference the current Libs over Labor, so it may not be something the party can influence. But it is interesting to look at the numbers needed, as in the RH column in Table 3, which shows that in Griffith only 2.3% of voters needed to change their preferencing in this way for Max to have retained Griffith. From one perspective, this was his losing margin (how close he got to a second term).
The same type of analysis is also informative for when the Greens win over the Libs. The one HOR seat the Greens won in 2025 was with a 2PP result of 53.3% against the Libs candidate, a margin of 3.5% or some 6,800 votes. But Elizabeth got a lot closer to losing than that as shown by the 3PP count in Table 4 below:
Table 4: Ryan 2025 3PP count
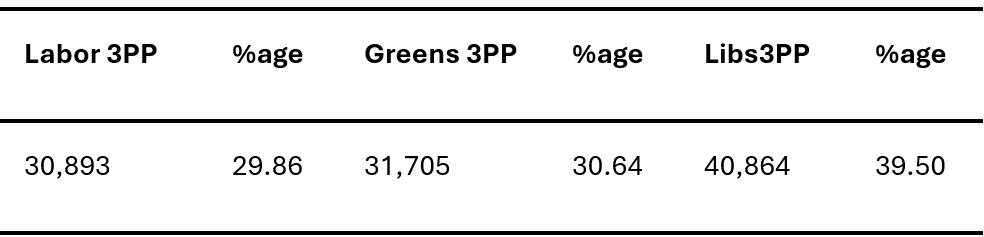
The Greens only had a 3PP margin of 1.78% or 812 votes over Labor preventing Labor from finishing 2PP with Libs and winning on Greens 3PP preferences. In this three-horse race, this is effectively the winning margin.
This shows the value of considering 3PP counts rather than the primary results.
Winning an electorate from third against Libs
There is only one 2025 3 horse race election mentioned above where the Greens were not in the 2PP count, Brisbane. In 2022, the Greens finished above Labor in the 3PP count and thus passed Libs at 2PP, but in 2025 this reversed and Labor were elected on Greens preferences.
And there are a few similar seats where the Greens came 3rd in the 3PP in 2025 where Libs were highest, for which the challenge is to surpass Labor at the 3PP count (to have a large enough 3PP swing from Labor to Greens) such that it becomes a head-to-head with Libs and so the Greens win on Labor 3PP preferences.
Unfortunately, a number of such opportunities have been disrupted by the advent of populist ‘Community Independents'. In traditionally Liberal seats like Curtin and Forrest in WA, the momentum building over a few elections to pass Labor at the 3PP count was usurped by the Independent candidates.
We can calculate the 3PP swing needed in Brisbane for a Greens win. At the 2025 3PP count for Brisbane where Libs were placed 1st with 38.7%, Labor at 33.8% had a 6.2% margin over the Greens at 27.6%. Thus, for the Greens to win on Labor preferences, it only required 3.1% of voters from among those who preferenced Labor and then Greens above Libs, to change their preferencing to put Greens above Labor.
Winning an electorate from third against Labor
The more common three horse electorate race the Greens find themselves in is where Labor finished first and the Greens finished third at the 3PP count. Many such seats, the most progressive in the country, have looked fertile for a Greens win (encouraged by the winning of Melbourne in 2010) and get prioritised campaign resources.
The commonly considered pathway to winning these types of seats is for the Greens to beat Labor on 2PP. As discussed earlier, this requires at 3PP count for Greens to be above Libs and also above Labor by more than ~1/3 of Libs 3PP count. This would likely entail 3PP swings from both parties to the Greens.
Alternatively, for such an electorate to be a Greens – Libs race with the Greens winning on Labor preferences, it requires more than just a 3PP swing from Labor to get Greens above Labor, it needs that swing away from Labor to be sufficient for Libs to also be above Labor at the 3PP count.
Calculating the needed 3PP swings from the old parties to the Greens, ‘winning pathways’, for a Greens win in these types of 3 horse races is thus a bit more complex. The swing to the Greens from one party is complemented by the swing from the other party, the sum of which along with the preferences to Greens from the remaining vote of the party now coming third, needs to lift the Greens 2PP vote to over 50%.
Perth winning pathways
Analysing a specific seat in this way might make the maths a bit clearer. The federal seat of Perth is an example of such a (Greens priority) electorate where in 2022 and 2025 the Greens was 3rd at the 3PP count.
Table 5 below has the primary results for Perth 2025 (and the primary swings). Then Table 6 has the Perth 3PP counts for both 2022 and 2025. Table 7 is then a tabulation of calculations for both elections for swings needed for Greens winning on Libs preferences (for 2 different percentages for Libs preference flows). This table also shows the 3PP swing needed solely from Labor to have Greens winning on Labor preferences.
Table 5: 2025 primary (first preferences) results for Federal Division of Perth
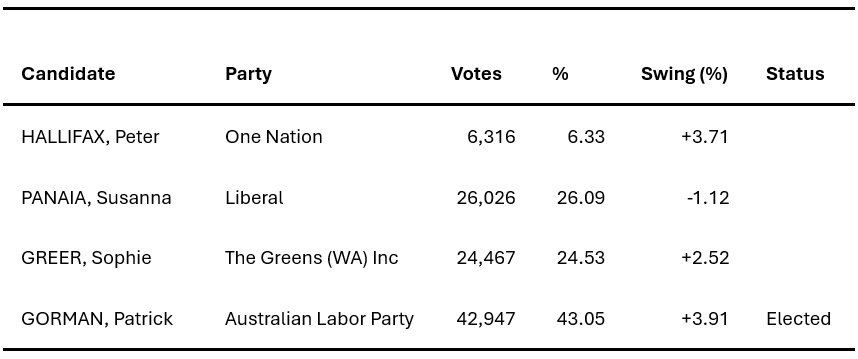
Note that while these primary voting results show 2025 primary swings from the 2022 election of up to nearly 4%, including a ‘solid’ swing to the Greens of 2.5%, this is largely attributable to a more restricted field of candidates in 2025 compared to the previous election. A comparison of 3PP counts for the two elections in Table 6 below shows only small swings between the 3 main parties relative to each other, largely a 1% drift from Libs to Labor with the Greens little changed.
Table 6: 2025 3PP count for Federal Division of Perth

This is another situation showing the value of considering 3PP counts rather than just the primary results.
Table 7 below shows Greens 2PP ‘winning pathways’ for Perth, as swings that were needed from the ‘actual’ 2022 and 2025 3PP election results. In each pathway, a 3PP swing from Labor to the Greens was chosen, as was the proportion of Libs 3PP preferences flowing to the Greens, to then calculate the needed Libs 3PP swing compared to the ‘actual’ Libs count for that election. Choosing a lower Labor swing necessitates choosing a higher Libs preference flow to keep the calculated Libs swing within reason (single digits).
Once the parameters are chosen, a Libs 3PP swing to the Greens is then calculated, along with the resulting Libs preferencing to the Greens as the proportion (the percentage as chosen) of the ‘new’ Libs 3PP count once the Libs 3PP swing is deducted from the ‘actual’ 3PP count. This calculation is done such that when the chosen Labor swing and the Libs swing are added to the ‘actual’ Greens 3PP count, and the Libs preferences are then added to this ‘new’ Greens 3PP, the ‘new’ Greens 2PP is above 50%.
For each election, calculations are shown in Table 7 for a Labor 3PP swing to the Greens of 6.5% and Libs 3PP preference flows to Greens of 50%, and an 8.5% Labor 3PP swing and a 30% Libs 3PP preference flow. Also shown is the calculation for the minimum swing from Labor 3PP to the Greens to get the outcome where Libs finish 2nd at 2PP and the Greens get Labor preferences at a flow of 80%. Note that the critical criterion in these latter calculations is that the ‘new’ Labor 3PP is down to the Libs ‘actual’ 3PP, at which point the Greens appear on 2PP to have won in a ‘landslide’ (although they would in fact be a close run contest).
Table 7: Calculated 3PP swings from Labor and Libs (with the ‘new’ 3PP counts) for Greens win in Perth
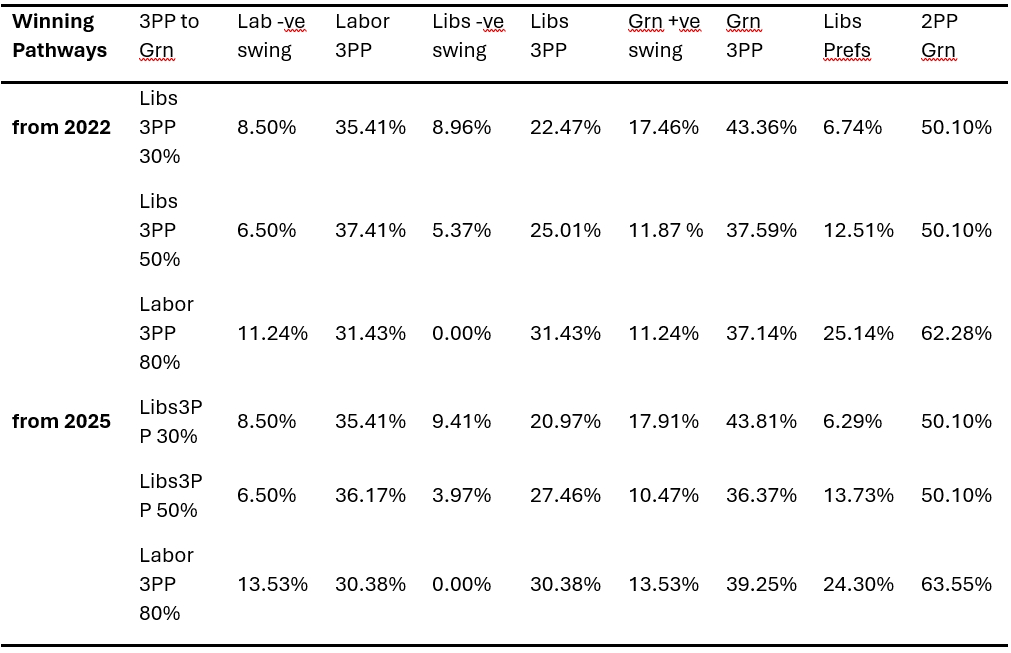
The table above indicates that with the common 3PP preference flow from Libs to Greens of 30%, 3PP swings beyond recent results to the Greens of about 8.5% from Labor and 9% from Libs are needed for a Greens victory. Thus about 17-18% of votes would need to change their preferencing for such a win.
With an unheralded 50% preference flow, lower 3PP swings to the Greens of about 6.5% from Labor and 4-5.5% from Libs are needed, only requiring 11-12% of voters to change their preferencing. Whilst the AG national office provided the latter modeling prior to the 2025 election, it carries an unrealistic value for Libs 3PP preference flows to the Greens.
The third line of calculation for each election in Table 7 looks at the alternative ‘pathway’ of getting to a Greens-Libs 2PP situation in Perth, with a Labor 3PP swing to the Greens but no equivalent Libs swing to not only to get the Greens 3PP above Labor, but to get Libs above Labor too. On the 2022 3PP count, 11.2% of voters (from those who do not have Libs preferenced above Greens and Labor) would have to change their preferencing to move Greens above Labor. From the 2025 3PP count, this figure is 13.5%. Both figures are unrealistic but any component of swing from Libs would compromise the requirement for Libs to finish 2nd at the 2PP count.
The photo finishes
From the above analyses, it is possible to discern the closeness of the 2025 HOR election results where the Greens were in the mix with the two old parties. This can be seen through a perspective of “how many voters needed to vote differently” for a Greens win.
The sole Greens HOR seat, Ryan, was won on a narrow 3PP margin 812 votes over Labor preventing Labor from finishing 2PP with Libs and winning on Greens 3PP preferences. Thus, while the 2PP count would suggest Libs need a 3.27% swing against Greens to win it back, Labor only need 1.78% to win on Greens preferences.
For the best of the 2PP results where the Greens lost, Wills only needs a swing from Labor to the Greens of 1.8% for a Greens win, whereas Melbourne needs 3.0%. Replication of Fraser’s 35% of the Lib 3PP preference flow going to Greens would have retained Melbourne and won Wills (which points to a significant avenue for investigation).
After Wills, from one perspective, Griffith was the Greens closest loss. It only needed 2.3% of voters to change their order of preferencing from Labor above Libs to the reverse, where they have both of them above the Greens, so that Libs as well as the Greens heads Labor in the 2PP count. Then the Greens would win on the final distribution of Labor preferences. Not that the Greens are likely to encourage preferencing Libs over Labor any time soon.
Although the Greens candidate in Brisbane did not feature in the 2PP count, it can be said that the results were nearly as close as for Melbourne. It only needed 3.1% of voters, for those who did not preference Libs over Labor and then Greens, to change their preferencing to have Greens above Labor, for the Greens to win on Labor preferences.
Analysis of 3PP results for electorates where the Greens have come third allows a clear assessment of the voting challenge ahead, the ‘pathways to winning’, irrespective of the number of minor parties in the race.
For such 3 horse races, when Libs have won, it is a very straightforward challenge to the Greens to get a swing where more of those voters who have preferenced Lib below the other two parties put the Greens above Labor irrespective of how they preference the minor parties.
Understanding 3PP preferencing in 3 way contests also can inform campaigning strategies, when trying to get a Greens win over Labor in a 2PP race. This requires at 3PP count for Greens to be above Libs and also above Labor by more than a significant portion of Libs 3PP count (the extra amount of Libs 3PP preferences that Labor will receive compared to the Greens).
In the first instance, to get to the 2PP count, the Greens candidate needs more voters to preference Greens above the Libs and Labor by more than the Libs over Greens and Labor. Then, they need enough voters who did preference Libs above the other two to preference Greens above Labor to meet the gap between the Greens 3PP count and the winning 50%.
For example, in that scenario it is just as valuable to convince a One Nation voter to put Greens 6th and Labor 7th as it is to convince a progressive voter to put Greens 1st and Labor 2nd, irrespective of where they preference Libs.
Note that the likely errors in statistics and arithmetic in this essay are all mine.
[Opinions expressed are those of the author and not official policy of Greens WA]