2024-07-04
A detailed analysis of WA’s efforts to reduce transport emissions shows that they are so timid, lacking in urgency and shrouded in secrecy around carbon accounting that they amount to nothing more than greenwashing
by Dr Mark Brogan, member of Greens WA Climate Crisis Working Group
Relative to the pre-industrial baseline of 1850-1900, WA recorded an average mean annual temperature increase of 1.5 °C to 2020.[1] The figure of 1.5 °C is globally significant as the warming threshold to which one hundred and ninety-six (196) nations committed, including Australia, as part of the Paris Agreement. Since 2020, warming in WA has continued with the BoM reporting in February 2024 that the mean maximum temperature was 3.8 °C above the 1961-1990 average.[2] Our summer of 2024 was also notable for a record number of days on which the recorded maximum exceeded 40°C. Many WA towns recorded their highest temperatures on record.[3] With temperatures soaring, speculation has become commonplace about the future liveability of parts of the State.[4]
There is widespread pessimism in the scientific community about current warming trends. The need to reduce Greenhouse Gas Emissions (GHG-e) both globally, and locally, has never been more urgent. The IPCC estimates that a 50% reduction is required by 2030 to reign in the worst effects of climate change. Elsewhere, Climate Analytics has found that the Australian Government’s target of a 43% reduction in emissions is too weak and that a 70% cut by 2030 is required for net zero by 2050.[5]
In this existential quest to reduce greenhouse gas emissions and to limit global warming, Western Australia is a rogue State. The ‘rosiest’ picture of WA emissions is painted when emissions are considered as ‘net’ (LULUCF) enabling the WA Government to claim only a 4% overall increase since 2005. Minus LULUCF, WA’s greenhouse gas emissions have increased by more than 10% since 2005.[6] There are two principal axes of public policy failure.
Firstly, support for the unconstrained exploration and mining of conventional and unconventional gas. There is no letup from the WA Government on its support for gas. Mega projects such as Scarborough and Browse, with major local and global GHG-e implications have no safe pathway in a rapidly warming world. But the WA Government is not willing to stop them, proffering the mythology that gas is a transition fuel.
Secondly, successive WA governments have shown limited appetite for reducing WA’s own emissions, even where reductions could be achieved with nett benefits to our community and economy. This article explores one such area- transport - reckoned to be worth around 20% of WA’s emissions budget. Transport is Australia’s third largest and fastest growing source of emissions.[7] As gas pollution expands because of public policy failure to constrain it, and de-carbonisation gains from transition of the electricity grid to renewables and batteries diminish, it is critical that transport’s carbon footprint in WA be massively reduced.
GHG-e from transport
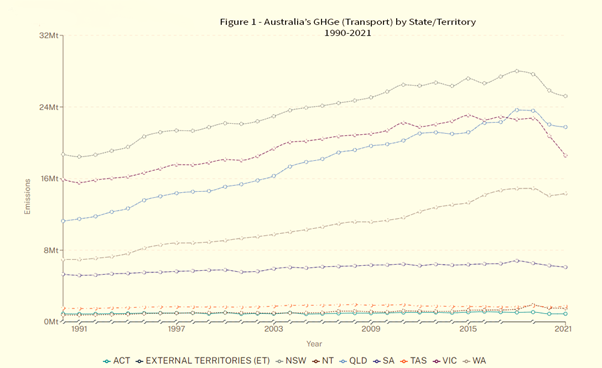
Based on annualised GHG-e inventory data, Figure 1 below shows WA’s transport emissions relative to other states as a time series 1990-2021.[8] The data reveal that:
- WA’s transport emissions have grown by 105.8% since 1990, the largest percentage increase recorded by any Australian State or Territory.
- While other Australian States recorded falls in transport emissions during the Covid period (2020-2021) WA’s transport emissions approximated pre-covid levels.
Since Covid, WA’s transport emissions have spiked sharply. The WA Government’s Sectoral Emissions Reduction Strategy[9] estimates 2024 transport emissions at 15.8 MtCO2-e, up 10.16% from 2021. With the NT, WA is the worst performing Australian State or Territory for transport emissions as measured by emissions growth.

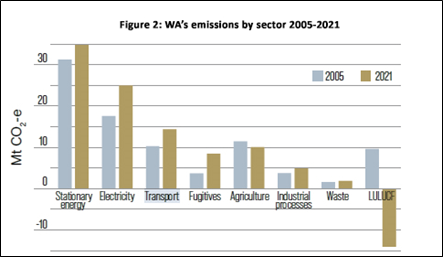
WA’s total GHG-e are less than the three largest states, but per capita emissions are the second largest in the country and growing.[10] In its sectoral emissions reduction strategy released in December 2023, the WA Government described transport’s contribution to overall carbon pollution (Figure 2).[11] Transport emissions accounted for around 18% of the State’s emissions in 2021. In aggregate, road transport accounts for 75% of these emissions.[12] The largest categories of transport emissions are passenger vehicles (32%), light commercial vehicles (16%), articulated vehicles (14%) and rigid trucks (10%). Within its stated policy goal of reducing the State’s emissions to Net Zero by 2050, the WA Government acknowledges that transport emissions must contract from 15.8 MtCO2-e in 2024 to 4.2 MtCO2-e in 2050 i.e. reduce by 70%.[13]

Reducing Emissions from Transport - Talking big and what the numbers really say
The WA Government believes that Zero-tailpipe Emissions Vehicles (ZEVs) hold the key to achieving its transport decarbonisation vision. The lynch pin of its strategy in this space is its State Electric Vehicle Strategy in which it has invested $200 million. It is investing $23 million in WA’s EV charging network.[14] The WA Government also believes that it can convert commuters to its low carbon Metronet rail based public transport system and grow micro-mobility via bicycles, e-bikes and e-scooters ($340 million).
The WA Government is talking big on its decarbonisation effort across multiple sectors including transport. But what is the reality?
Growth in ZEVs and emissions savings
As of Q1 2024, as a percentage of total sales, sales of BEVs in WA accounted for 7.6% of new vehicle sales, just under the national average of 8.7%.[15]
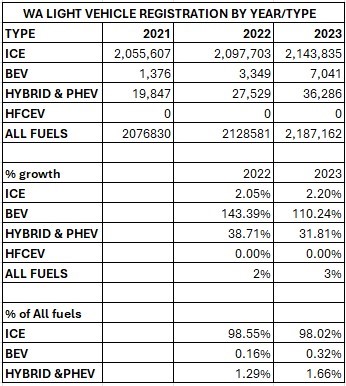
Sounds promising. But car registration data paints a different picture. The data show that while Electric Vehicle (EV) registrations are growing with new vehicle sales, so too are new registrations of Internal Combustion Engine (ICE) powered vehicles. Table 1 tells the story. In 2023, ICE registrations in WA grew by 46,132 vehicles on 2022 figures accounting for 98.02% of total registrations. In the same year, BEV registrations grew by 3,692 vehicles accounting for 0.32% of total registrations. When combined with Hybrid and PHEV registrations, low emissions technology vehicles accounted for 43,327 registrations or 1.98% of registered vehicles. The data show that growth in ICE registrations outpaced zero and low emissions vehicles in 2022-2023. This means that ICE expansion is effectively undermining gains made with zero or lower tail pipe emissions vehicles. Expansionary trends in ICE registrations mean that we have yet to achieve any emissions reductions in private use transport, contrary to the WA Government’s rhetoric and big talking of it’s electric vehicle strategy.

Table 1- Annual Registration by Vehicle Type in WA 2021-2023[16]
In its showcase of climate initiatives called Climate Action in WA[17] the WA Government touts its EV Network Project (due for completion in 2024) as a driver of private vehicle electrification.[18] But the investment is modest ($20 million) and will result in only 98 EV charging stations across 49 locations. The EV Network Project is an example of a supply side driver to EV adoption. The WA Government also has a demand side strategy to stimulate EV uptake based on a Zero Emissions Vehicle (ZEV) rebate of $3,500.[19] Since its introduction in 2022-2023 the Government has processed 6821 applications worth $23.87 million. As part of its 2024-2025 budget announcements, a further $5.2million has been budgeted covering a further 1,486 rebate applications.[20]
Comparison of these figures with Table 1 shows that growth in BEV registrations 2022-2023 is strongly associated with the availability of the rebate. This suggests a major limitation of rebates as a demand side driver of adoption. To achieve at scale adoption, with no changes to barriers to entry, the price tag for Government quickly becomes unaffordable. As things stand, with only 6821 BEV registrations directly attributable to the rebate incentive, only 7.09 KtCO2 can claim to be saved annually. The modest character of the return is stark when viewed against the sectors expected emissions in 2024, namely 15.8 MtCO2-e. The savings equate to 0.04%.
Australian (and Western Australian) consumer preference for SUVs and light trucks (aka utes) is growing our emissions problem. Passenger vehicle sales have been in decline since 2000 when they accounted for 71.2% of new vehicles sales. In 2023, passenger vehicle sales amounted to only 30.1% of new vehicles sales. In the same time period, SUV sales grew from 13.1% to 46.0% of the market. Light trucks (utes) have grown from 15.7% of the market to 23.9% of the market.[21] Over the past decade (2014-2023), small car sales have collapsed from 252,427 units to 84,360 units i.e. have declined by 66.6%.[22]
Problems associated with consumer preference for high polluting vehicle types have been compounded by the Federal Governments weakening at the knees on how large SUVs and utes should be treated under its new fuel efficiency standard.[23] The revised rules reduce emissions reduction ambition in the light commercial category and enable large SUVs and utes purchased as private passenger vehicles to be treated as light commercial vehicles. Under the revised rules, an expected cut to national emissions of 369MtCO2 by 2050, will be reduced to 321MtCO2.[24]
Well if that’s not working, what about electrification of our bus fleet?
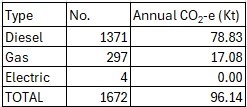
If the WA Government’s performance on electrification of private vehicles is disappointing, is any joy to be found in public transport electrification? On 16 April 2024, in response to a question from Greens MLC, Dr Brad Pettitt, The Minister for Transport, Stephen Dawson advised that no electric buses had been purchased in the FYR 2022-2023. Rather the Government had elected to buy ninety-three diesel buses instead.[25] In an earlier question from March, Dr Petitt requested that the Minister for Transport quantify the bus fleet by energy source.[26] Of the total current at the time (1,672) only four (4) comprised BEV, the remainder made up predominantly of diesel (1,371) and to a lesser extent gas (297). Unlike some other Australian States, the WA fleet contains no hybrid buses.

Table 2. Transperth fleet profile by fuel type 2024
In 2023, investigation by UWA’s Future Smart Strategies Group revealed that since 2020, 225 diesel buses had been delivered, with 126 more scheduled for 2022-2023.[27] The same study found only 46% met the Euro 5/6 emissions standard, which was in place from 2009 to 2014, a further one third meet Euro4 (2005), and a further 20.5% met the decades old Euro1-3 standard (1993-2000).
The current Transperth fleet has a very large carbon footprint. However, the WA Government does not publish annualized emissions data for its bus fleet. Utilising claimed savings from its four electric buses as the basis for estimating whole of fleet emissions, Table 2 suggests annualized emissions of 96.1 KtCO2. Claimed savings from the four zero emissions BEB in service (230t), represent 0.24% of total emissions from the fleet. Next to nothing.
Responding to criticism over its continuing reliance on diesel and gas, the WA Government committed to $22 million in new funding for electric buses as part of its 2022-2023 budget cycle, enabling the purchase of a further 18 e-buses.[28] Overall funding inclusive of Federal assistance, is currently reckoned by the WA Government at $250 million enabling the delivery of 130 electric buses in all, but with no delivery date.[29] The delivery timeline for the 18 buses budgeted in 2022-2023 is mid-2025 and this is the figure used in the comparative table below.[30] Table 3 describes fleet transition by zero or low emission technology type in other states and territories inclusive of current and budgeted delivery to 2025:
|
|
BEB |
Hybrid |
H2 Fuel Cell |
TOTAL |
|
ACT[31] |
106 |
1 |
0 |
107 |
|
NSW[32] |
200 |
0 |
1 |
201 |
|
NT[33] |
0 |
0 |
0 |
0 |
|
SA[34] |
1 |
24 |
2 |
27 |
|
TAS[35] |
4 |
0 |
3 |
7 |
|
QLD[36] |
30 |
0 |
0 |
30 |
|
VIC[37] |
36 |
127 |
0 |
163 |
|
WA[38] |
22 |
0 |
0 |
22 |
Table 3. Bus fleet transition by State /Territory (current and projected to 2025)
Once more the picture isn’t flattering. Data suggest that the WA Government is a clear laggard in the adoption of zero or low emissions technologies with its bus fleet. However, as part of its Climate Action in WA promotion, the WA Government characterizes itself as being on the front foot with bus electrification. Table 3 shows that such a claim is laughable and amounts to little more than greenwashing.
Other sources of GHG-e savings in transport
As mentioned, WA Government’s sectoral analysis of emissions posits a 70% reduction in transport emissions by 2050 to achieve its Net Zero By 2050 target.[39] But EVs and electrification of the bus fleet describe just two of many emissions reduction pathways available to the WA Government. Together they address the 33% of current transport emissions from passenger vehicles and buses. They cannot achieve the 70% reduction required by the Net Zero by 2050 target. The remaining sub-sectors account for 67% of current transport emissions. These include rail (15%), light commercial (16%), articulated vehicles (14%), rigid trucks (10%), other transport (8%) and domestic air travel (4%).[40]
In Western Australia, abatement/mitigation strategies for these sectors appear not to have progressed beyond the thought bubble stage of development. In the sectoral analysis they are described as ‘harder to abate’. Affordable EVs across all vehicle segments is seen as an essential enabler.[41] According to the WA Government, planning and support should be available to help with small operator uptake of low emission trucks.[42] And there should also be a statewide strategy for future electric road transport charging infrastructure and a road freight decarbonisation strategy.[43]
Other programs in the sector that are important to improved emissions outcomes include:
- Increasing commuter utilisation of rail which has lower carbon intensity compared with commuter car journeys;
- Lifting fuel diversity in heavy and light commercial transport. With incentives, electrification and hydrogen fuel cell technologies have clear potential to make inroads into road freight and commercial transport emissions. These sectors account for forty percent of WA’s transport emissions; and
- Increasing utilization of active transport such as bikes, e-bikes and e-scooters.
These pathways are all acknowledged in the sectoral analysis, but goals, data and emissions reduction projections are missing. For example, with its flagship rail network transportation project, Metronet, the WA Government expects to lower GHG-e, but there are no data that provide a quantitative measure of savings.
Review of the Infrastructure Australia (IA) projections on Mitchell and Kwinana traffic freeway traffic flows post Phase 2 & 3 upgrades raises doubts about the likelihood of Metronet having a significant impact on emissions.[44] In its Business Case Evaluation Summary, IA attributes higher overall Vehicle Kilometres Travelled (VKT) post upgrade with a net environmental dis-benefit in net present value terms of $124 million.[45] The evaluation points to road infrastructure upgrades encouraging road use, resulting in “higher VKT and greater environmental externalities through increased emissions of greenhouse gases.”[46] Coupled with population growth projections, road infrastructure improvements mean that the moderating effect of improvements in rail public transport on GHG-e is likely to be outpaced by emissions from increased VKT.
Openness and transparency with data sets is required for robust analysis of current and future carbon accounting under various action scenarios. But the WA Government prefers not to do numbers by choice and when it does, it prefers not to reveal them. Investigative journalists at the ABC recently revealed how the WA Government hid emissions data and analysis contained in a report it commissioned from Climateworks Centre working in co-operation with the CSIRO.[47] The Report remains secret except for a few headline statements. The report concluded that under current policies and industry plans, the WA Government would not achieve its goal of NetZero by 2050 and that emissions reductions by 2030 and 2035 would need to double.[48] In apparent confirmation of conclusions from this study, Climateworks also found that transport emissions were expected to remain largely stagnant between now and 2035, relegating to the realm of fantasy the WA Government’s projection of 70% saving by 2050.[49]
Taking out the greenwashing: Avoid-Shift-Improve to reduce WA’s transport emissions
The Metronet case study shows how gains made from shifting travel behaviour to public transport could be subverted by improvements to roads that make road transport more attractive. Population growth and continuing reliance on ICE vehicles will also contribute to growth in VKT travelled and to more, rather than less carbon pollution. Even if our passenger vehicle fleet could be converted to Zero Emission Vehicles (ZEVs) overnight, we would still need to address the other sub-sectors of road transport that account for around sixty percent of emissions.
Taking greenwashing out of the public policy mix and transitioning transport in WA to a low carbon future requires a shift in thinking to a more comprehensive and rigorous public policy framework. A framework that links targets to robust action plans that are measured against carbon accounting outcomes. This is the kind of public policy methodology used by Climateworks in its recent released study of decarbonising Australia’s transport sector.[50] Applying an Avoid-Shift-Improve (ASI) framework to a ‘diverse portfolio of solutions’, Climateworks decarbonisation plan claims a credible 1.50 C pathway for Australian transport based on an emissions benchmark sectoral budget of 1,330 MtCO₂-e 2025 -2050.[51] This pathway is more resilient to single point failure including slower than expected ZEV uptake, something that might be expected in WA given the data contained in Table 1. Assumptions (targets) behind the claimed GHG-e savings include:
- Avoidance of ten per cent (10%) of passenger kilometres travelled (pkm) across all passenger trips by 2035 due to fewer trips and shorter journeys.
- Avoidance of five per cent (5%) of tonne kilometres (tkm) across all freight by 2035 with efficiencies and optimisation of logistics networks.
- A mode shift of 35% of pkm from car use to public and active transport by 2040.
- A mode shift of 20% of articulated and rigid truck freight from road to rail.[52]
After accounting for all assumptions, Climateworks claims a 27% decrease in vehicle kilometres travelled for all road vehicles, including a 30 percent decrease by light vehicles to 2050.[53]
Conclusion
The 1.50 C pathway agreed in Paris in 2016 means global greenhouse gas emissions have to peak before 2025, and roughly halve by 2030, before reaching net zero greenhouse gas emissions in the second half of this century. 1.5°C-aligned action would halve the speed of global warming in the 2030s and halt it by the middle of the century. This warming slow down is critically important to buy time for adaptation and avoid irreversible loss and damage.
But as I write this article, a recent research article in the Proceedings of the National Academy of Sciences (PNAS) has revealed that the rate of atmospheric CO2 increase is occurring 10x faster than at any time in the last 50,000 years.[54] The need for action on climate has never been more urgent.
However, there is no sense of urgency in the response of the WA Government to the 20% of our emissions that come from transport. Far from it. The response is largely performative, owing more to voter perception management, than policy for ‘at scale’ action that transitions the transport sector to a low carbon future. Across all abatement options, progress is desultory amounting to little more than greenwashing. This disingenuousness on climate and emissions reduction is hidden behind a veil of secrecy surrounding carbon accounting and WA’s rightful share of carbon pollution under the Paris Agreement.
It is plain from this analysis and work done by ClimateWorks, Climate Analytics and others that WA is not on track to secure the 70% reduction in transport emissions required by its NetZero by 2050 goal. Of its own volition, the WA Government has acknowledged that transport emissions are set to grow in the short term. We are on a highway to hell with transport emissions in WA and hard decisions are urgently required in the transport space to bring about serious emissions reductions that are linked to the 1.50 C pathway required for a safer climate future.
Header Photo: Graphic adapted from Arek Olek's Highway to Hell: Road to Walbrzych. Licensed under CC
[Opinions expressed are those of the author and not official policy of Greens WA]
ENDNOTES
[1] Grose, M. et. al. (2020). Australian climate warming : observed change from 1850 and global temperature targets. Retrieved from:- https://doi.org/10.1071/ES22018
[2] Australian Government Bureau of Meteorology. (2024). Western Australia in February 2024. Retrieved from http://www.bom.gov.au/climate/current/month/wa/archive/202402.summary.s…
[3] Ibid.
[4] The Australia Institute. (2019). Heat Watch: Extreme heat in the Kimberley. Retrieved from: https://australiainstitute.org.au/wp-content/uploads/2020/12/P830-Kimbe…
[5] Hare, Bill (2024). Sleight of Hand” Australia’s Net Zero target is being lost in accounting tricks, offsets and more gas. The Conversation. Retrieved from: https://theconversation.com/sleight-of-hand-australias-net-zero-target-…
[6] Australian Broadcasting Commission. (2024). WA's greenhouse gas emissions continue to climb above 2005 levels despite net zero pledge. Retrieved from: https://www.abc.net.au/news/2024-04-24/western-australia-greenhouse-gas…
[7] Climateworks Centre. (2024). De-carbonising Australia’s transport sector : Diverse solutions for a credible emissions reduction plan. Retrieved from: https://www.climateworkscentre.org/wp-content/uploads/2024/06/Decarboni…
[8] Australian Government. Department of Climate Change, Energy, the Environment and Water. (n.d.) Australia's National Greenhouse Accounts: Emissions by state and territory. Retrieved from:- https://greenhouseaccounts.climatechange.gov.au/
[9] Government of Western Australia. Department of Water and Environmental Regulation. (2023). Sectoral Emissions Reduction Strategy for Western Australia: Pathways and priority actions for the State’s Transition to Net Zero Emissions. Retrieved from: https://www.wa.gov.au/service/environment/environment-information-servi…
[10] Campbell, R. (2023). The Northern Territory is the world leader for per-capita emissions. The Australia Institute. Retrieved from: https://australiainstitute.org.au/post/the-northern-territory-is-the-wo…
[11] Government of Western Australia. Department of Water and Environmental Regulation. (2023). Sectoral Emissions Reduction Strategy for Western Australia. p.13
[12] Ibid. p.22
[13] Ibid.
[14] WA.gov.au (2024). Electric Vehicle (EV) Strategy. Retrieved from: https://www.wa.gov.au/service/environment/environment-information-servi…
[15] Australian Automobile Association. (2024). Data-Report-Electric Vehicle Index. Retrieved from: https://data.aaa.asn.au/ev-index/
[16] ibid.
[17] Government of Western Australia. (2024). Climate action in WA. Retrieved from: https://www.climateaction.wa.gov.au/how-you-can-take-action
[18] Government of Western Australia. (2024). Climate Action in WA: WA EV Network. https://www.climateaction.wa.gov.au/initiatives/wa-ev-network
[19] Government of Western Australia. Department of Transport(2024). Zero Emission Vehicle (ZEV) Rebate. Retrieved from: https://www.transport.wa.gov.au/projects/zero-emission-vehicle-zev-reba…
[20] WA.gov.au (2024). Government to expand successful EV rebate scheme. Retrieved from: https://www.wa.gov.au/government/media-statements/Cook-Labor-Government…
[21] Federal Chamber of Automotive Industries. (2024). The Australian New Vehicle Industry. Retrieved from: https://www.fcai.com.au/wp-content/uploads/2023/02/fcai_new_vehicle_ind…
[22] RAC WA (2024). Where have all the small cars gone? Winter 2024 p.11
[23] Visontay, E and Butler, J. (2024). Labor unveils watered down fuel efficiency standard that eases emission rules for large SUVs. The Guardian 26 March 2024. Retrieved from: https://www.theguardian.com/australia-news/2024/mar/26/labor-new-vehicl…
[24] Ibid.
[25] Parliament of Western Australia. (2024). Parliamentary Question: Question Without Notice no. 294, 16 Apil 2024. Retrieved from: https://www.parliament.wa.gov.au/parliament/pquest.nsf/viewLAPQuestByDa…
[26] Parliament of Western Australia. (2024). Parliamentary Question: Question Without Notice no. 225, 20 March 2024. Retrieved from: https://www.parliament.wa.gov.au/parliament/pquest.nsf/viewLAPQuestByDa…
[27] Bleakely, Daniel (2023). WA to make 130 electric buses in belated switch away from diesel. Retrieved from: https://thedriven.io/2023/04/24/wa-to-make-130-electric-buses-in-belate…
[28] ibid
[29] Barker, S. (2023). WA Government to electrify bus fleet with $250 million. Infrastructure April 24, 2023. Retrieved from: https://infrastructuremagazine.com.au/2023/04/24/wa-gov-to-electrify-bu…
[30] Climate Action in WA. (2024). Electric Bus Program. Retrieved from https://www.climateaction.wa.gov.au/initiatives/electric-bus-program
[31] https://www.act.gov.au/our-canberra/latest-news/2023/may/more-electric-…
[32] https://www.transport.nsw.gov.au/system/files/media/documents/2022/zero…
[33] https://dipl.nt.gov.au/__data/assets/pdf_file/0013/1306210/electric-veh…
[34] https://dit.sa.gov.au/news?a=1116687; https://www.adelaidemetro.com.au/about-us/go-green
[35] https://www.busnews.com.au/metro-tasmania-introduces-new-suite-of-elect…
[36] https://www.abc.net.au/news/2022-04-13/electric-buses-rolled-out-queens…
[37] https://www.ptv.vic.gov.au/footer/about-ptv/improvements-and-projects/b…
[38] Climate Action in WA. (2024). Electric Bus Program. Retrieved from https://www.climateaction.wa.gov.au/initiatives/electric-bus-program
[39] Government of Western Australia. Department of Water and Environmental Regulation. (2023). Sectoral Emissions Reduction Strategy for Western Australia: Pathways and priority actions for the State’s Transition to Net Zero Emissions. p32. Retrieved from: https://www.wa.gov.au/service/environment/environment-information-servi…
[40] Ibid, p.22
[41] Ibid, p.24
[42] Ibid.
[43] Ibid.
[44] Infrastructure Australia. (2022). Mitchell and Kwinana freeways upgrade: Phases 2 & 3: Business Case Evaluation Summary. Retrieved from: https://www.infrastructureaustralia.gov.au/sites/default/files/2022-10/…
[45] Ibid., p.4
[46] Ibid., p.5
[47] Climateworks Centre. (2024). We bridge the gap between research and climate action. Retrieved from: https://www.climateworkscentre.org/
[48] Shine, Rhiannon. (2024). WA has no hope of achieving net zero emissions targets by 2050 without radical change, secret government report finds. Retrieved from:- https://www.abc.net.au/news/2024-05-19/wa-wont-achieve-net-zero-emissio…
[49] Ibid.
[50] Climateworks Centre. (2024). Decarbonising Australia’s Transport Sector : Diverse solutions for a credible emissions reduction plan. Retrieved from: https://www.climateworkscentre.org/resource/decarbonising-australias-tr…
[51] Ibid., p.14
[52] Ibid., p.18
[53] Ibid.
[54] Klampe, M. (2024). Chemical analysis of natural CO₂ rise over the last 50,000 years shows that today's rate is 10 times faster. Phys.org. May13, 2024. Retrieved from: https://phys.org/news/2024-05-chemical-analysis-natural-years-today.html
