2026-03-09
How to calculate the return on investment on home batteries
By Jonathan Hippisley, Greens Climate Crisis Working Group
Introduction
It is a cliché that solar batteries, batteries designed to store solar energy to power a home, are expensive. But how expensive are they really? Are their prices rising or falling, and are they a viable investment.
The answers to these questions depend on where you look, and to some extent where you are. Being located in Australia is not an advantage.
How to calculate viability
There are five key numbers you need to calculate the viability of a solar battery investment:
1. The gross price of the battery (fully installed) GPB
2. The capacity of the battery in kilo-watt hours (kWh) CB
a. 1 kWh is the energy used when you run a 1kW appliance for an hour,
b. 1 kWh is also a single unit of electrical energy on your electricity bill,
3. If you divide gross price GPB by capacity CB you get the third key number, which is price per kWh, PB. This is a handy metric for comparison with other batteries.
Algebraically: PB = GPB / CB
4. The price of the electricity, pe, being sold from the battery into the grid or replaced by output from the battery per kWh (or unit)
5. The life cycle of the battery, NB, defined as the number of complete charge and discharge cycles it can perform.
If n units of electricity from a battery are sold for a price pe, the revenue R earned will be given by:
R = n.pe
If n units of electricity from a battery are used to replace n units that would otherwise have been purchased for a price pe, the expenditure E saved will be given by:
E = n.pe
When calculating the viability of a battery, it doesn’t matter whether you are looking at revenue from sales to the grid or savings from electricity not bought from the grid, as long as they all add up over the life of the battery to more than the price of the battery.
In reality people might do a mixture of both, and at many different prices. So anyone could keep a spreadsheet record of the sales that have been made at different prices, and/or the units of electricity not bought at different prices, multiply the units of electricity by the various prices, and add up all the revenues and savings when the battery dies.
But if you want a quick and dirty calculation it is easiest to assume a single price, pe for all the units of electricity that will be produced by the battery over the course of its life. And for each kWh of battery capacity, the number of units sold will be equal to the number of complete charge and discharge cycles the battery can perform, or its life cycle NB. The product of NB and pe will give you the total lifetime revenue or expenditure saved (it doesn’t matter which), and for investment to be viable, this must be equal to or greater than price per kWh, PB, of the battery.
NB.pe ≥ PB (1)
If this condition is satisfied, you might also be interested in finding the number of cycles nbe, which generate exactly the number of units required to break even. This number will be contained in the expression:
nbe.pe = PB
To make nbe the subject of the equation you divide both sides of this expression by the sale or substitution price pe :
nbe = PB / pe (2)
So the break even number of cycles is the ratio of the battery price per kWh to the electricity sale or substitution price per kWh. And if you complete a whole cycle every 24 hours (which you will if your battery is just right or slightly too small for your needs) the break even number of cycles will also be the break even number of days. This is sometimes called the crude cash payback period (CCPP).
Battery prices in different parts of the world
Historically, Australian retail battery prices have been many multiples higher than those in other parts of the world.
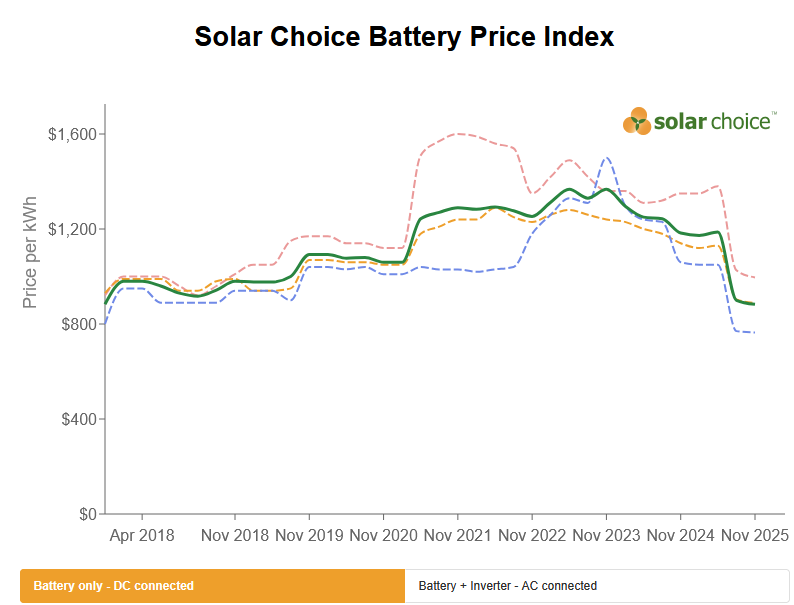
Solar Choice is a widely used Australian web site providing information on battery prices in Australia. On the chart1 below, the line in green shows the index of battery prices in the 1-15 kWh range since 2018. The chart shows Australian battery prices rising over the five years to $1,367 in November 2023 but then falling back to $883/kWh in November 2025. In May 2025 they were $1,187.
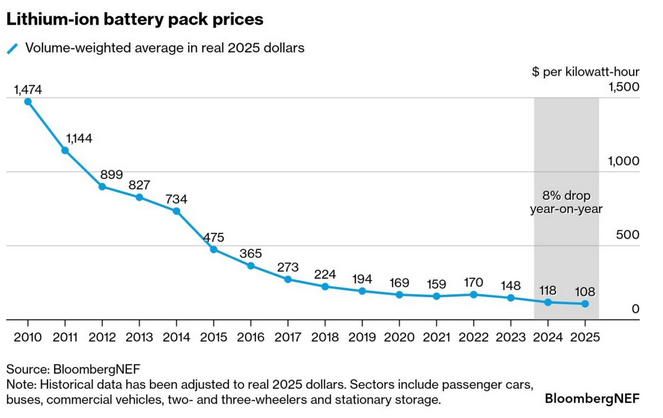
PV magazine describes itself as the world’s leading solar storage media platform, publishing monthly in English and German. Their chart2 (shown below) tells a very different story, with battery pack prices falling almost continuously from USD1,474/kWh in 2010 to USD108/kWh in 2025.
Unfortunately neither Solar Choice nor PV magazine qualify their charts with life cycle information.
KUGA Energy, a major Australian solar infrastructure contractor, has a web page3 suggesting that lithium-ion batteries generally offer between 2,000 to 5,000 cycles. Lead-acid batteries might provide 500 to 1,500 cycles, while bromide flow batteries can exceed 10,000 cycles.
In order to do some “back of the envelope” calculations on the impact of both battery prices and electricity prices on the viability of a house battery investment, I shall assume a cycle life of 3,500.
Impact of battery prices on viability
Using the Solar Choice chart, I shall feed the following values into the viability condition shown in Expression 1 shown above:
- Battery price PB = $883 per kWh
- Electricity replacement price pe = 30c/kWh
- Life cycle NB = 3,500
Is the condition for viability satisfied?
3,500 x 0.3 = 1,050 > 883
Yes it is, but only just, and if I substitute the same numbers into the break even calculation shown in Expression 2:
nbe = 883 / 0.3 = 2,943
The CCPP is 2,667 days or just over 8 years.
Substituting the May 2025 price of $1,187, into Expression 1:
3,500 x 0.3 = 1,050 < 1,167
So the condition for viability was not met as recently as May last year. This probably explains the relatively low levels of battery penetration in Australia.
In December 2025 nearly 40% of Australian houses had PV panels6, but in June 2025 only 1% of Australian houses had solar batteries. Since the introduction of a Federal Government solar battery rebate on July 1 2025 the number of battery installations has almost doubled, but still only 2% of Australian houses have solar batteries6.
One way to work around the greed of monopolistic commercial battery producers and the general disinterest of the electrical trades is to build your own battery. The author has recently ordered 8x1kWh lithium iron phosphate (LiFePO4 or LFP) cells from EVE Energy, Guangdong, China, for just $1,000, delivered to the WA Wheatbelt. Add $100 for a battery management system (BMS) and another $100 for cables and you have a 8kWh battery for $1,200 or $150 per kWh. This clearly meets the condition for viability, and if you substitute this price into Expression 2:
nbe = 150 / 0.3 = 500
The CCPP is 500 days, which is less than one and a half years.
Another glimpse of hope on the horizon arises from the entry of new competitors into the battery market. One example is China’s Ruixu, which was founded in 2017 and is an integrated manufacturer of LFP cells and batteries. Its Lithi2-16 product is CEC certified. The top page of a Google search reveals only one Australian installer, LiFePO4 Australia7 (there are probably more, less favoured by the Google algorithm), who advertise “$14k after rebates” for a 48kWh battery. That’s $292/kWh. This is also clearly viable; and if you substitute this price into Expression 2:
nbe = 292 / 0.3 = 972
The CCPP is 972 days, just over two and a half years, which certainly makes it look like a good investment.
Impact of electricity prices on viability
The calculations shown above assume energy from the battery is being used to replace electricity purchased from the grid at 30c/unit. This is close to the all day rate charged by many electricity companies. But what if an investor purchased a battery purely for the purpose of selling power to the grid? How would that work out today?
In WA Synergy8 offers a peak feed-in tariff (FiT) of 10c/kWh from 3pm-9pm and an off-peak rate of 2c/kWh at other times. If you put the Ruixu Lithi2-16 price and the Synergy peak FiT into Expression 1:
3,500 x 0.1 = 350 > 292
Here the condition for viability is met. But if you use Synergy’s off peak rate, which includes all the overnight hours of darkness:
3,500 x 0.02 = 70 < 292
This is no longer a viable investment.
Fifteen years ago, generous FiTs created a bonanza in solar panel investment, to the extent that today there is a surplus of solar energy during the day, not least because there is nowhere to store it. Synergy’s 2c/unit night time FiT almost seems designed to punish battery owners with surplus capacity. It is as if the senior managers at Synergy, or their masters in State Government, fear battery ownership in private hands.
The Sun only shines powerfully for 6-8 hours a day. If we are to solve the climate crisis we need to harvest and store enough of the Sun’s energy during the day to last us through the night. The State government should encourage this, not discourage it.
Conclusion
Battery prices are reaching the point where batteries used to replace power from the grid are becoming viable, and even attractive, investments. But not every household will invest in them. The government therefore needs to signal encouragement to battery investors to buy a little more than they need. The FiT pricing structure in the current Distributed Energy Buyback Scheme (DEBS) does the opposite.
Sources
- Solar Choice (URL: https://www.solarchoice.net.au/solar-batteries/price/)
- PV Magazine (URL: https://www.pv-magazine.com/2025/12/09/global-lithium-ion-battery-pack-…)
- Kuga Energy (URL: https://www.13kuga.com.au/how-long-does-a-solar-battery-last-a-comprehe…)
- RUiXU (URL: https://www.ruixubattery.com/ruixu-14-3kwhpowerbank-51280)
- WAGov (URL: https://www.wa.gov.au/organisation/energy-policy-wa/energy-buyback-sche…)
- Solar Calculator (URL: https://solarcalculator.com.au/blog/solar-energy-facts-and-statistics/)
- LIFEPO4 Australia (URL: https://lifepo4.com.au/?v=8bcc25c96aa5)
- Energy Matters (URL: https://www.energymatters.com.au/renewable-news/best-feed-in-tariffs-au…)
Header photo: Home batteries. Source: https://solarbatterygroup.com.au/
[Opinions expressed are those of the author and not official policy of Greens WA]