
2026-10-30
Should high night time FiTs be used to stimulate battery investment?
By Jonathan Hippisley, Greens (WA) Climate Crisis Working Group
Introduction
Above market feed in tariffs (FiTs) in the 2000s stimulated strong interest in solar and were associated with a massive explosion in household photovoltaic (PV) investment. Should something similar be tried now to stimulate household investment in batteries?
Solar Boom
FiTs were first introduced in Australia in 2008, following the success of similar schemes in Germany1. South Australia and Queensland led the charge, followed by Victoria in 2009, and the remaining states in 2010. In WA, FiTs during the first two phases were paid at two rates: one fixed, one variable. Both were called renewable energy on customer invoices, but the fixed one was also called Net Feed-in Tariff2
FiT level and duration in WA
| Sign in period | FiT | Duration |
| 1/7/2010 to 30/6/2011 | 40c plus 7-8c variable | 10 years |
| 1/7/2011 to 31/7/2011 | 20c plus 7-8c variable | 10 years |
| 1/8/2011 to 30/8/2020 | 7-8c variable | Until system change |
| 31/8/2020 to present | 2c 9pm-3pm, 10c 3-9pm | Current |
Solar Quotes2
Source: CER3
In 2005 the total PV capacity in WA was only 250kW. In 2009 it was 18 MW. In 2011 it jumped from 60MW to 183MW. And even after the high FiTs were discontinued investment in PV continued apace, reaching 3,333MW in 20263.
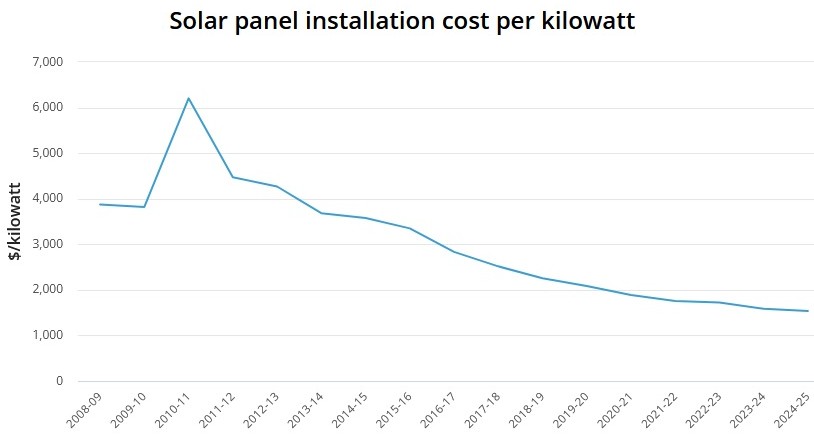
The continued momentum of investment after FiTs began to fall has been partially ascribed to the “Neighbourhood Effect”4 or fear of missing out (FOMO). Running along side this was a decline in the unit cost of solar panels. During the 2010-11 tax year the average PV installation cost was $6,203/kW. This fell steadily during the next fifteen years and was around $1,500/kW in Australia by 20255.
Australian Bureau of Statistics5
Quantifying the cost and effectiveness of FiTs in south west WA
The 40c FiT was available not only to installs during the year of currency but also to existing installs. Synergy6, in their 2011 Annual Report, said there were 19,356 Renewable Energy Buyback Scheme (REBS – the scheme offering the high FiTs) clients at the start of the year. This number had risen to 58,511 by the end of the year. In the 2011 Annual Report, they reported 33,805 new REBS clients during the year. They did not say exactly how many new installs were registered in July, the month with the 20c FiT, but they did say 14,469 new installs were registered in the second half of the financial year6. For my calculations, I’ll assume 10,000 customers were on the 20c FiT.
REBS customers at start and end of each sign in period
| Date period begins | FiT Rate | Existing Customers | New Customers | Year average |
| 1/07/2010 | 40c | 19,356 | 39,155 | 29,256 |
| 1/07/2011 | 40c | 58,511 |
| 58,511 |
| 1/07/2011 | 20c |
| 10,000 | 10,000 |
Synergy6
In order to estimate the cost of these FiTs we need to estimate
- Average output per kW of installed capacity
- Average capacity for the years of currency, based on
- Uptake of special FiT deal
- Install size
- Installer use of power generated
- The hypothetical cost of producing the fossil fuel power replaced.
According to Future Solar WA7, Perth enjoys an average of 5.8 peak sun hours daily. A 6.6kW system in Perth can produce around 25 to 30 kWh per day on average over the course of a year comprising 35-40 kWh/day in summer months and around 15 to 20 kWh/day in winter. That’s roughly 4kWh/per day per kW of installed panels. The special FiT contracts were only available for a 2kW inverter size.
Estimating the hypothetical cost of producing the fossil fuel power replaced is not a trivial exercise. Luckily, I have found two documents which have done the work. The Economic Regulation Authority Final Report on Synergy’s Costs and Electricity Tariffs (ERAFRSC) estimated efficient wholesale electrical energy costs in the range of 14-15c/kWh (Table 9)8. Looking further forward the CSIRO GenCost9 document puts the cost of energy generated from both coal and gas in the range of $1-200/MWh or 10-20 cents per kWh, the midpoint of which is15c/kWh.
I summarise my assumptions in the table below:
Assumptions
| Install size | variable |
|
| kWh/kW per day | 4 |
|
| Customer utilization | 50% |
|
| Percentage exported | 50% |
|
| Supply cost $/kWh | $0.15 |
|
| FiT1 fixed and var | $0.40 | $0.08 |
| FiT2 fixed and var | $0.20 | $0.08 |
The results of these assumptions are shown in the table below. The estimated cost of the scheme is slightly lower than subsidies published in ERAFRSC Table 388, but close enough to suggest the model is broadly sound.
Estimates of the cost of the high FiTs compared with the subsidies received
| Year End | FiT | Opening | New | Average | Size | Cost/day | Cost $m | Both $m | Subsidy |
30/06/2011 | $0.48 | 19,356 | 39,155 | 38,934 | 1.5 | 38,544 | 14.07 | 14.07 | $13.0m |
30/06/2012 | $0.48 | 58,511 | 0 | 58,511 | 1.5 | 57,926 | 21.14 |
| |
30/06/2012 | $0.28 | 0 | 10,000 | 5,000 | 1.5 | 1,950 | 0.71 | 21.85 | $24.0m |
30/06/2013 | $0.48 | 58,511 | 0 | 58,511 | 1.8 | 69,511 | 25.37 |
| |
30/06/2013 | $0.28 | 10,000 | 0 | 10,000 | 1.8 | 4,680 | 1.71 | 27.08 | $29.8m |
30/06/2014 | $0.48 | 58,511 | 58,511 | 1.8 | 69,511 | 25.37 |
| ||
30/06/2014 | $0.28 | 10,000 | 10,000 | 1.8 | 4,680 | 1.71 | 27.08 | $30.3m |
The table above estimates the cost of the abnormally high FiTs, but it says nothing about the benefits of the power generated by householders who invested in solar panels then and after the high FiT schemes were discontinued. In order to estimate this, I use the CER3 CSV tables (with calendar year end used as a proxy for the financial year average capacity), and the GenCost midpoint of 15c/kWh for value.
Economic value of electricity generated by domestic solar panels
| Year End | MW | $000/day | $m/yr | Cum$m/yr |
| 30/06/2010 | 60 | $36 | $13.14 | $13.14 |
| 30/06/2011 | 183 | $110 | $40.08 | $40.08 |
| 30/06/2012 | 283 | $170 | $61.98 | $102.05 |
| 30/06/2013 | 353 | $212 | $77.31 | $179.36 |
| 30/06/2014 | 448 | $269 | $98.11 | $277.47 |
| 30/06/2015 | 544 | $326 | $119.14 | $396.61 |
| 30/06/2016 | 672 | $403 | $147.17 | $543.78 |
| 30/06/2017 | 859 | $515 | $188.12 | $731.90 |
| 30/06/2018 | 1,069 | $641 | $234.11 | $966.01 |
| 30/06/2019 | 1,315 | $789 | $287.99 | $1,253.99 |
| 30/06/2020 | 1,651 | $991 | $361.57 | $1,615.56 |
| 30/06/2021 | 2,005 | $1,203 | $439.10 | $2,054.66 |
| 30/06/2022 | 2,292 | $1,375 | $501.95 | $2,556.61 |
| 30/06/2023 | 2,565 | $1,539 | $561.74 | $3,118.34 |
| 30/06/2024 | 2,851 | $1,711 | $624.37 | $3,742.71 |
| 30/06/2025 | 3,119 | $1,871 | $683.06 | $4,425.77 |
| 30/06/2026 | 3,333 | $2,000 | $729.93 | $5,155.70 |
The table above shows an estimated value for the electricity generated over the last 17 years by domestic solar panels in excess of $5 billion. Even if the participants in the original FiT schemes were paid $30 million a year for 10 years, the $300 total is dwarfed by the value of the electricity generated by them and subsequent investors. Even when Synergy were paying 7c/kWh under the old REBS, they were still paying half the ERAFRSC8 estimated fair value of the electricity purchased.
Anyone who says that the original high FIT‘s hurt either the tax payer or other electricity consumers is not seeing the whole picture.
Can the same thing be done with batteries?
To some extent it already has.
Source SunWiz10
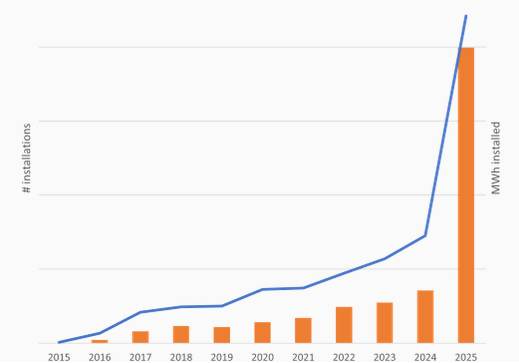
The Federal Government Cheaper Home Batteries Program (CHBP)11 not only reduced the cost of buying a battery by about a third, but also made solar investment trendy again. People have not only been buying batteries but also buying bigger batteries than ever before10.
During 2025, the year the CHBP was introduced, there was a threefold increase in system count and a fivefold increase in capacity10, to just shy of 5,000 MWh3. A further 7,000 MWh was added in the first four months of 2026 taking the total to 12 GWh3.
So should we all pack and go home, take the rest of the day off … maybe not quite yet.
The Federal government, stunned by the success of the scheme and alarmed at how quickly they were using up their budgeted spend on the project, remodelled it, with the changes taking effect in May 202611. Alongside the predictable howls of protest from the Luddite climate denying right wing parties, there had been concerns expressed on the left about the risks of favouring wealthy Australians12.
But when they changed the rules, I wonder whether the government considered the risk of favouring individual wealthy Americans, such as Elon Musk?
Source: Solar Choice13
According to SunWiz10, the original Cheaper Home Batteries Program didn’t just boost volumes ‒ “it fundamentally reshaped what Australians buy, which brands are winning, and where the opportunities are heading next”10. Larger modular batteries from market newcomers such as Riuxu17 were favoured at the expense of the traditional smaller high-end batteries produced by monopolistic market abusers such as Tesla.
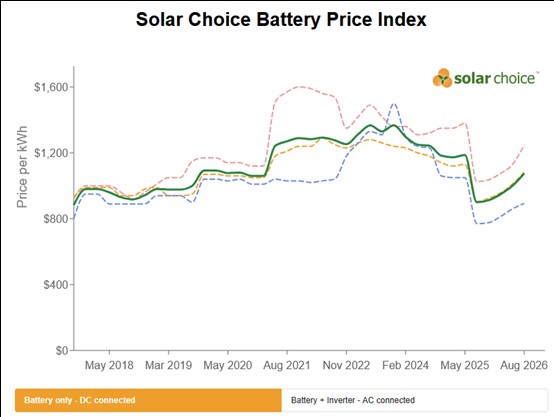
From the chart above, it can be seen that battery prices, even in Australia, were beginning to fall. But under the new rules11 the small-scale technology certificate (STC) is only fully applied for batteries smaller than 14kWh – almost tailor made for the Tesla Powerwall. The oligopoly of small battery producers took full advantage of this, and the chart above shows an up-tick of battery prices.
The chart below shows the impact of the rules changes on battery investment. I used NSW to illustrate this, because they led the charge on battery investment, having in the order of 5.2GWh by July 2026, out of around 13.4GWh nationwide3.
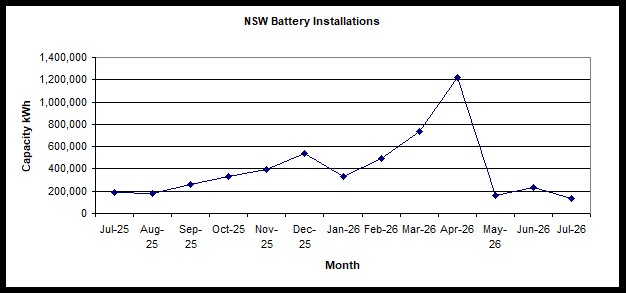
Source: CER3
Estimating the optimal battery capacity to solar power ratio
In WA, the total residential battery capacity in July 2026 was just over 1GWh3. Around the same time there was 3.3 GW3 of solar power – three times as much solar power as battery capacity. What is the ideal ratio?
It was mentioned above that WA home-owners might expect an average of 4kWh/per day per kW of installed panels7. To calculate how many solar panels they need a home-owner needs to know how many kWh/day they consume and divide that by 4. They then need to recognise that the sun shines strongly for roughly a quarter of a day, so three quarters of their daily need must be stored in a battery. To keep the math simple, suppose a home consumes 24kWh/day. They will need 6kW of solar panels and 18kWh of battery storage. The ratio of solar power to battery capacity will be 1:3 not 3:1. At today’s solar power level of 3.3 GW, the target battery capacity for WA might be around 10 GWh – ten times the current level.
The case for higher night-time FiTs
When a battery subsidy is paid upfront, it is very easy for battery manufacturers and installers to add a chunk of that to their profit margins. Doing so might be immoral and illegal, but it is very difficult to prove and even harder to prosecute.
Higher FiTs are much harder to steal from the battery investor, because it is difficult to quantify and predict the returns for the battery investor, not least because battery investors will prioritise consumption substitution over selling to the grid.
Synergy has a time of use plan called the Midday Saver14, which is very attractive to battery owners. Under the plan electricity is very cheap (currently 8.85c/kWh) between 9am and 3pm, very expensive (currently 55.3c/kWh) between 3pm and 9pm, and moderately expensive (currently 24.3c/kWh) between 9pm and 9am.
For anyone using the plan, the first priority of a battery investment will be to cover the period between 3pm and 9pm. During this period they will be saving 55.3c for every kWh they consume. The second priority will be to cover the period between 9pm and 9am. The bottom priority would be selling to the grid, unless the FiT went above the overnight Midday Saver14 rate, which I am not recommending.
This is an advantage for the government. They could advertise higher overnight FiTs and get all the credit for being environmentally conscious, but even if they offered above the ERAFRSC8 estimated fair value of electricity purchased, it wouldn’t cost them very much money, because very few people would use it, and those that did would just sell token amounts after they have met their internal consumption priorities.
The Synergy DEBS15 currently offers 10c/kWh for exports between 3pm and 9pm and 2c/kWh at all other times. Paying only 2c/kWh from 7am to 3pm sends a legitimate signal to the market that enough electricity is flowing into the SWIS when the sun is up. But paying the same rate between 9pm and 7am sends the wrong signal, because it implies there also a surplus of electricity at night, which there is not.
Offering a night time rate of 10c/kWh between 9pm and 7am would send a signal to the market that consumer exports during these hours would be welcomed by the grid. Such exports would mostly displace fossil fuel energy. ERAFRSC8 made a case that 14-15c/kWh was a reasonable estimate for the cost of electricity, so Synergy would arguably make no losses from the purchases, even if the scheme was heavily used.
Battery economics
A further argument in favour of higher night-time FiTs is that they offer an advantage to the larger more cost-effective modular batteries without giving wealthier investors in those batteries a big upfront subsidy. The nation and the world need more battery storage, and if anyone can be persuaded to buy a slightly bigger battery than they need for their own use, the planet wins.
In an earlier Green Issue article16 I offered a formula to calculate the viability of a battery investment. I give the full derivation of the formula in that article, but in summary, if a battery with a predicted lifetime cycle count N costs $P/kWh, the break even price p/kWh of electricity replaced or sold to the grid will be given by:
N.p = P
In other words, the total revenue generated (or costs saved) must at least equal the battery price; so the break even price will be:
p = P/N (1)
A Queensland battery installer, LIFEPO420 Australia, offers a 50kWh Ruixu bundle for $15,000 or $300/kWh. Solar Quotes18 says “the battery is rated for 9500 cycles at 80% DOD over 10 years, with a guaranteed State of Health (SOH) ≥ 60% during this period” 18. If you plug that in Expression 1, you get:
p = 300/9500 = 3.1c
Synergy’s current night-time FiT of 2c/kWh is below the break even price even for this battery at the extreme low end of the market, but an overnight FiT of 10c/kWh would be well above the break even price. It could therefore be used to stimulate investment in larger batteries, and hence reduce night-time fossil fuel consumption and reduce greenhouse emissions.
Conclusion
Above market feed in tariffs (FiTs) in the 2000s stimulated strong interest in solar and were associated with a massive explosion in investment in the technology. Although it seemed extravagant at the time, the value of the electricity, produced by solar panels installed then and since, has dwarfed the cost.
I am now recommending that Synergy should modify the DEBS to extend its “peak rate” FiT of 10c/kWh to cover the period from 9pm to 7am. This is well below the ERAFRSC8 estimated fair value of electricity, but above the break even point for the largest and most cost-efficient batteries. Stimulating investment in those batteries should benefit the consumer, the state electricity supplier, and the planet.
Sources
- Econnex (URL: https://www.econnex.com.au/energy/blogs/how-solar-feed-in-tariff-works-…)
- Solar Quotes (URL: https://www.solarquotes.com.au/systems/feed-in-tariffs/wa/)
- CER (URL: https://cer.gov.au/markets/reports-and-data/small-scale-installation-po…)
- PV magazine (URL: https://www.pv-magazine-australia.com/2024/08/08/neighbourhood-uptake-o…)
- ABS (URL: https://www.abs.gov.au/articles/household-solar-electricity-generation-…)
- Synergy (URL: https://www.synergy.net.au/About-us/News-and-announcements/Annual-repor…)
- Future Solar WA (URL: https://futuresolarwa.com.au/roi-for-6-6kw-solar-system-in-perth-wa/)
- ERA (URL: https://www.erawa.com.au/sites/default/files/Final%20Report%20-%20Syner…)
- CSIRO (URL: https://www.csiro.au/en/research/technology-space/energy/Electricity-tr…)
- SunWiz (URL: https://www.sunwiz.com.au/battery-market-report-australia-2026/)
- DCCEEW (URL: https://www.dcceew.gov.au/energy/programs/cheaper-home-batteries/eligib…)
- The Conversation (URL: https://theconversation.com/batteries-for-all-not-just-the-rich-labors-…)
- Solar Choice (URL: https://www.solarchoice.net.au/solar-batteries/price/)
- Synergy (URL: https://www.synergy.net.au/Your-home/Energy-plans/Midday-Saver)
- Synergy (URL: https://www.synergy.net.au/Your-home/Manage-account/Solar-connections-a…)
- Green Issue (URL: https://greens.org.au/wa/news/solar-battery-prices-and-economic-viabili…)
- LIFEPO4 (URL: https://lifepo4.com.au/product-category/bundles-2/ruixu-bundles/)
- Solar Quotes (URL: https://www.solarquotes.com.au/blog/ruixu-lithi2-16-battery-mb3230/)
Header photo: Home battery. Credit: https://www.carboeurope.org/
[Opinions expressed are those of the author and not official policy of Greens WA]